

In August, the New York Fed released a new update on household debt today showing record levels. What does it imply for the gold market?
On surface, the report about the household debt is scary, as the total household debt rose by $114 billion (0.9 percent) to $12.84 trillion in the second quarter of 2017. This increase put overall household debt $164 billion above its peak in the third quarter of 2008, and 15.1 percent above its trough in the second quarter of 2013. However, the assets surged as well. Hence, the household net worth is at a record high, as the chart below shows.
Chart 1: Households liabilities (blue line, left axis, $bn) and net worth (red line, right axis, $bn).
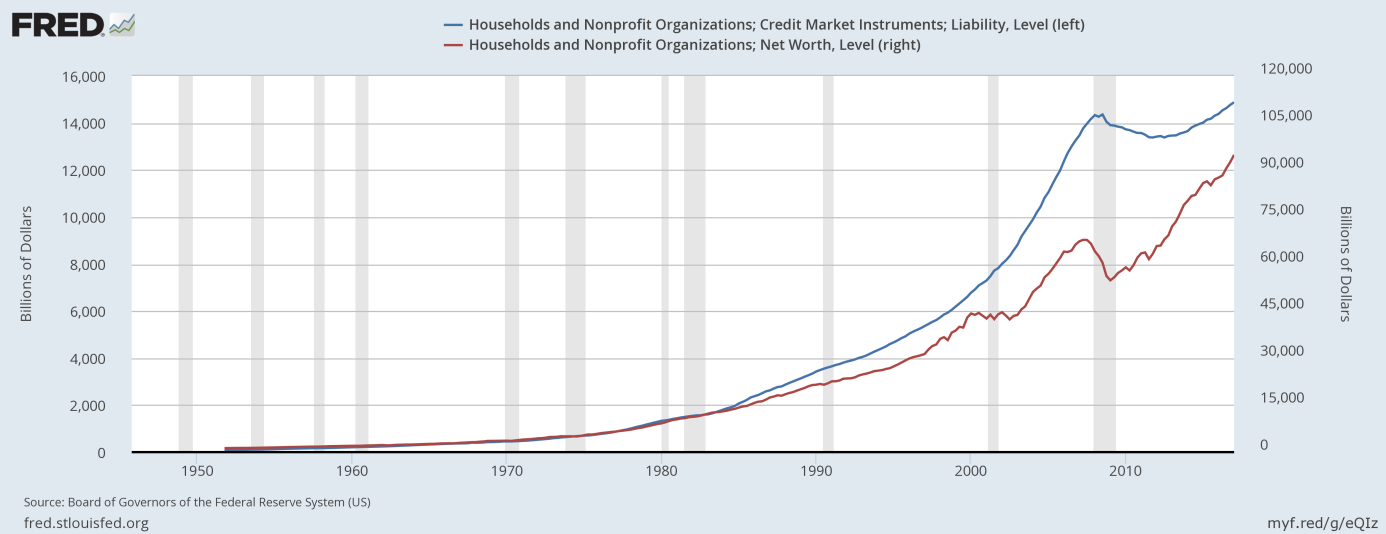
Surely, it should not comfort investors, as the net worth also peaked before the burst of the financial crisis of 2007-2009. However, what is important is the fact that household debt as a share of GDP has fallen dramatically in the last few years, as one can see in the chart below.
Chart 2: Household debt as a percent of GDP (red line, right axis) and the household debt service payments as a percent of disposable personal income (blue line, left axis) since the 1980s.
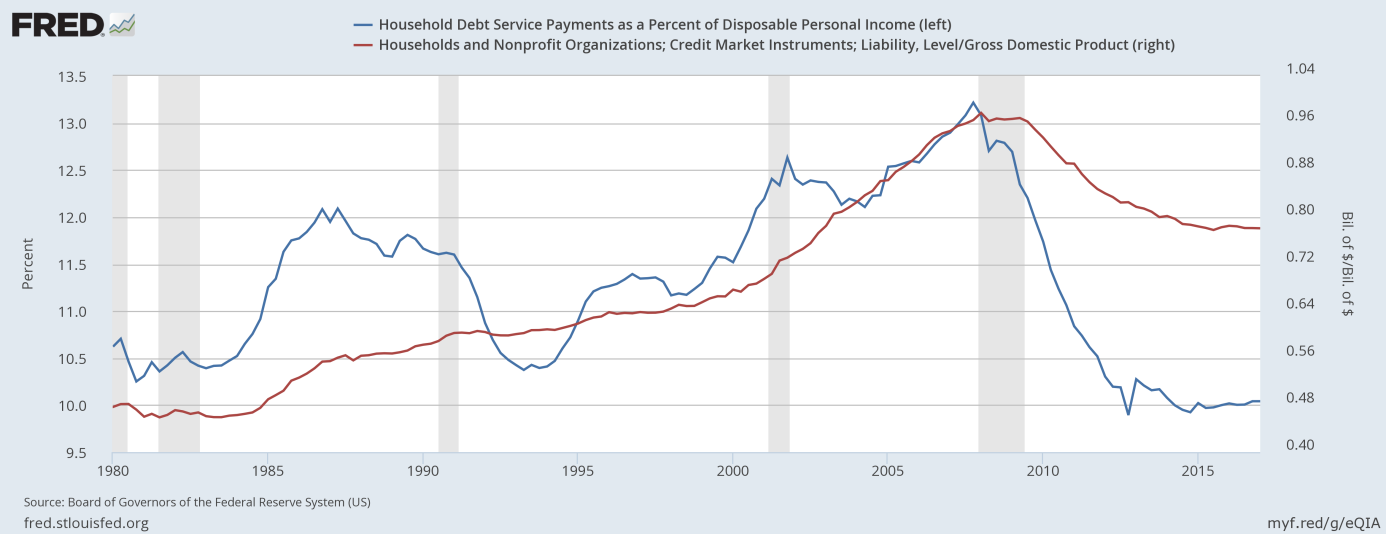
Please note that the household debt service payments also decreased significantly as a percent of disposable personal income. This chart is, thus, very important. It shows that the households have been deleveraging since the Great Depression, which explains the sluggish growth in the recent years. It is difficult to grow like crazy when household reduce their indebtedness. Moreover, the share of the household debt as a percent of the GDP is much lower than before the financial crisis of 2007-2009, so their financial condition is much better. Moreover, the quality of the new debt has also improved. It implies that the current macroeconomic outlook is much healthier and that the next crash is not imminent. It is bad news for the doomsayers and gold as a safe-haven, but good for the U.S. economy.
Summing up, the new peak in household debt has been reached. However, it is far less worrisome than the levels we saw in 2008, as the household debt is now much lower percentage of both the GDP and the disposable personal income. Hence, the specter of the next recession is weaker than commonly perceived. Actually, households have now some room to increase their indebtedness and spending again, so the GDP may accelerate in the future. This is bad news for the gold, which serves as an insurance against tail risk, while struggles during a period of sustainable and high economic growth.
If you enjoyed the above analysis, we invite you to check out our other services. We focus on fundamental analysis in our monthly Market Overview reports and we provide daily Gold & Silver Trading Alerts with clear buy and sell signals. If you’re not ready to subscribe yet and are not on our mailing list yet, we urge you to join our gold newsletter today. It’s free and if you don’t like it, you can easily unsubscribe.
Disclaimer: Please note that the aim of the above analysis is to discuss the likely long-term impact of the featured phenomenon on the price of gold and this analysis does not indicate (nor does it aim to do so) whether gold is likely to move higher or lower in the short- or medium term. In order to determine the latter, many additional factors need to be considered (i.e. sentiment, chart patterns, cycles, indicators, ratios, self-similar patterns and more) and we are taking them into account (and discussing the short- and medium-term outlook) in our trading alerts.
Thank you.
Arkadiusz Sieron
Sunshine Profits‘ Gold News Monitor and Market Overview Editor
Gold News Monitor
Gold Trading Alerts
Gold Market Overview
