

The U.S. stock market indexes lost between 0.7% and 1.5% on Wednesday, as the investors' sentiment worsened again. The S&P 500 index remains close to 2,700 mark and it currently trades 6.0% below the January's 26th record high of 2,872.87. The Dow Jones Industrial Average lost 0.7% and the technology Nasdaq Composite lost 1.5%, as it was relatively weaker than the broad stock market on Wednesday.
The nearest important level of resistance of the S&P 500 index remains at around 2,740-2,750, marked by the previous support level along with Monday's daily gap down of 2,742.94-2,752.68. The next resistance level is at 2,780-2,800, On the other hand, the support level is at around 2,695-2,700, marked by Monday's daily low. The support level is also at 2,675-2,680, marked by the late May local low.
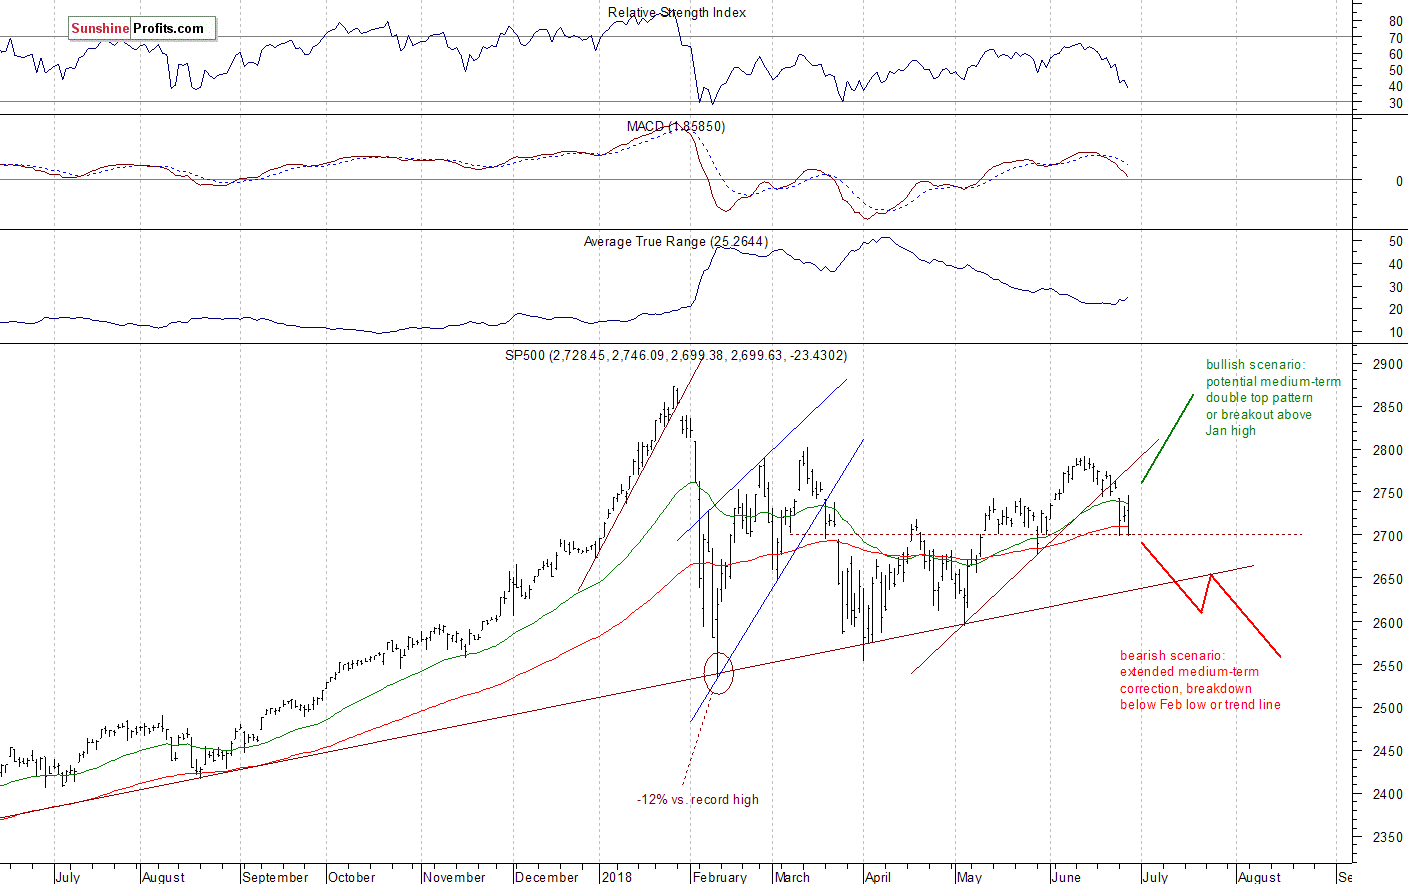
The broad stock market accelerated its short-term downtrend on Monday, as the S&P 500 index fell the lowest since the end of May. Will the downtrend continue? Or was it some final panic selling before an upward reversal? It's hard to say. If the index breaks below 2,700 mark, we could see more downward action. There are still two possible medium-term scenarios - bearish that will lead us below the February low following trend line breakdown, and the bullish one in a form of medium-term double top pattern or a breakout towards 3,000 mark. There is also a chance that the market will just go sideways for some time, and that would be positive for bulls in the long run (some kind of an extended flat correction). The S&P 500 index broke below its two-month-long upward trend line recently:
More Uncertainty Along the Support Level
Expectations before the opening of today's trading session are slightly positive, because the index futures contracts trade 0.3% higher vs. their yesterday's closing prices. The European stock market indexes have lost 0.1-0.5% so far. Investors will wait for some economic data announcements: Final GDP number, Initial Claims at 8:30 a.m. The broad stock market will probably extend its short-term fluctuations along the support level today. We may see more short-term uncertainty. Is this some bottoming pattern before an upward reversal or just a relatively flat correction before another leg lower? For now, it looks like a correction within a short-term downtrend. There have been no confirmed positive signals so far.
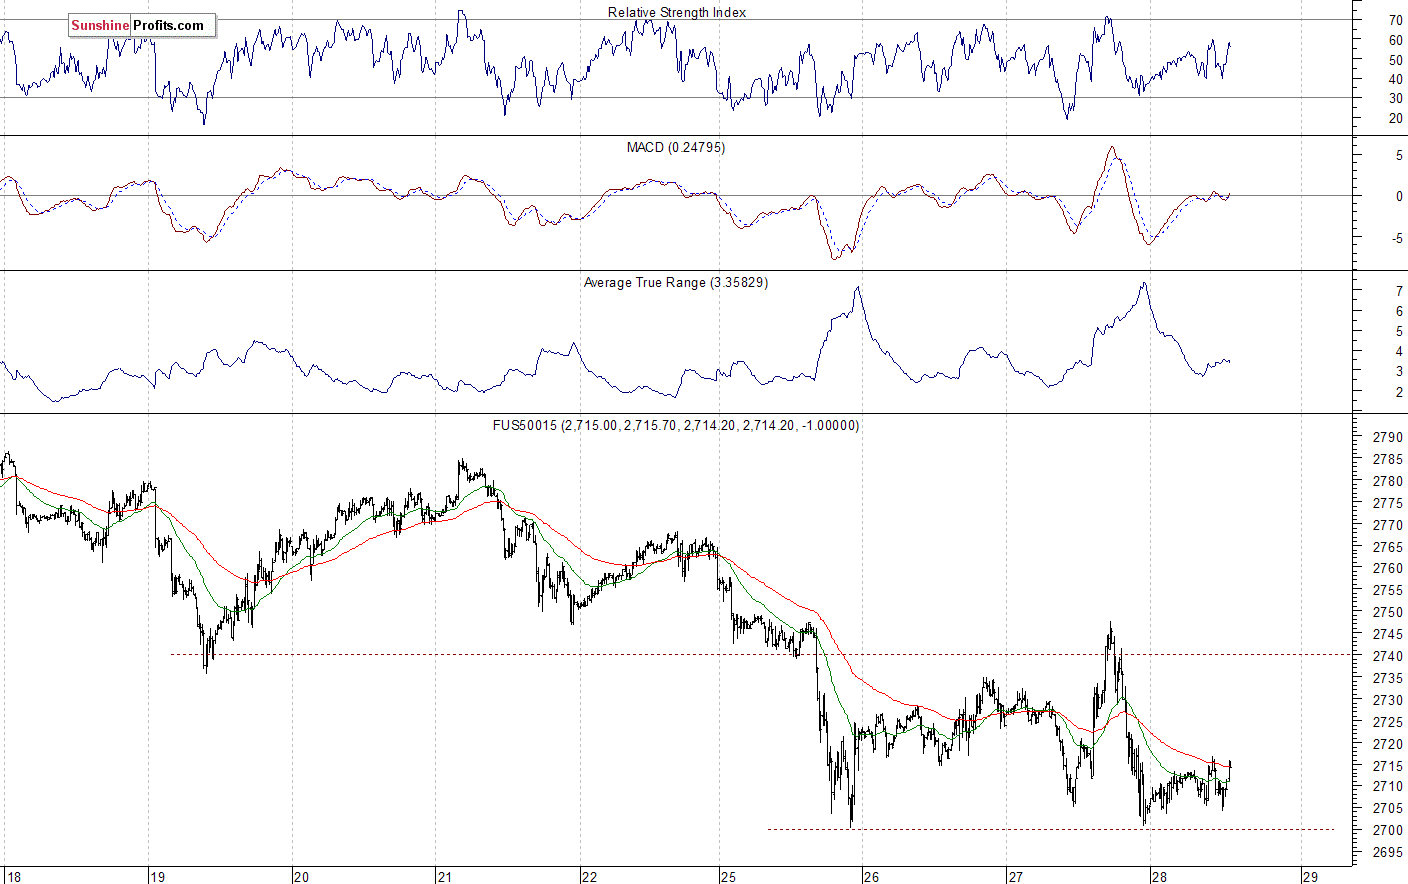
The S&P 500 futures contract trades within an intraday consolidation following yesterday's intraday sell-off. The nearest important level of support is at around 2,700, marked by the local low. On the other hand, the nearest important level of resistance is at around 2,730-2,740, marked by the local highs. The futures contract remains close to the level of 2,700, as we can see on the 15-minute chart:
Nasdaq Still at 7,000 Mark
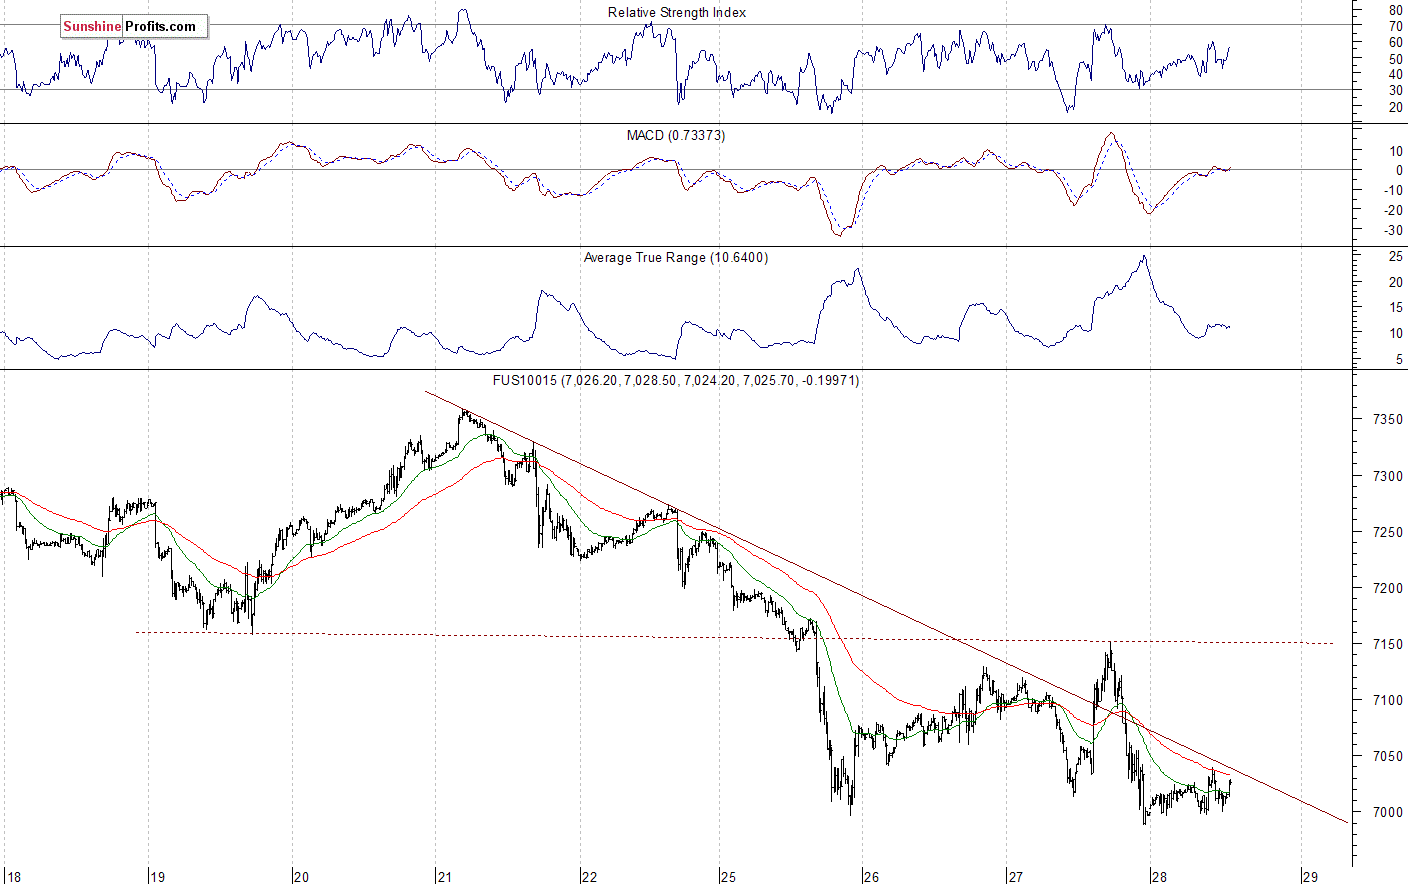
The technology Nasdaq 100 futures contract follows a similar path, as it trades within an intraday consolidation. It retraced its yesterday's advance following bouncing off the resistance level of around 7,100-7,150. On the other hand, support level remains at the above-mentioned 7,000 mark. The level of support is also at 6,900. The Nasdaq futures contract trades along its short-term downward trend line, as the 15-minute chart shows:
Apple, Amazon - Trending Lower?
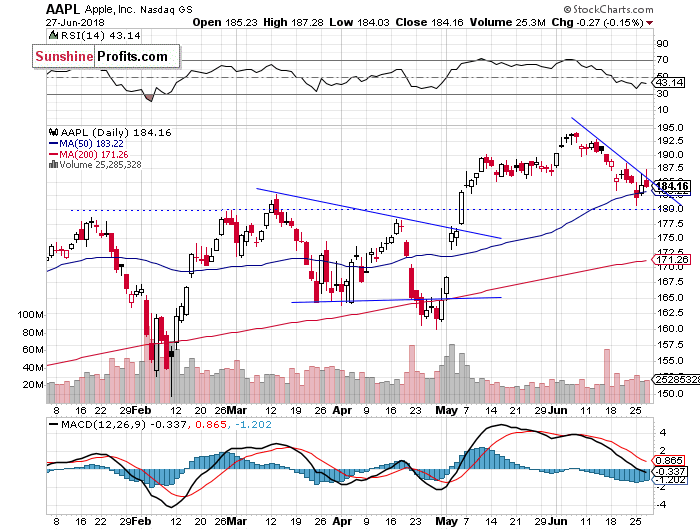
Let's take a look at Apple, Inc. stock (AAPL) daily chart (chart courtesy of http://stockcharts.com). It trades within a short-term downtrend since the beginning of the month. The decline accelerated on Monday, as price got closer to a potential support level of $180. Then it rebounded and got close to its downward trend line again. Will it continue lower? There have been no confirmed short-term positive signals so far:
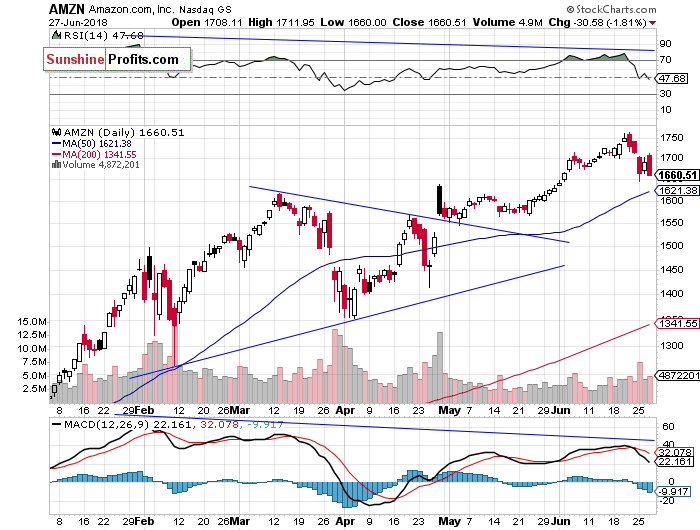
Now let's take a look at Amazon.com, Inc. stock (AMZN) daily chart. It reached the new record high on Thursday a week ago, as it was relatively much stronger than the broad stock market. Then it reversed its uptrend on Friday and accelerated lower on Monday. We saw negative technical divergences in the recent days. They signaled a potential downward reversal. The level of resistance is now at around $1,700. We saw a potential upward reversal pattern (bullish harami) yesterday morning, but yesterday's price action didn't confirm it:
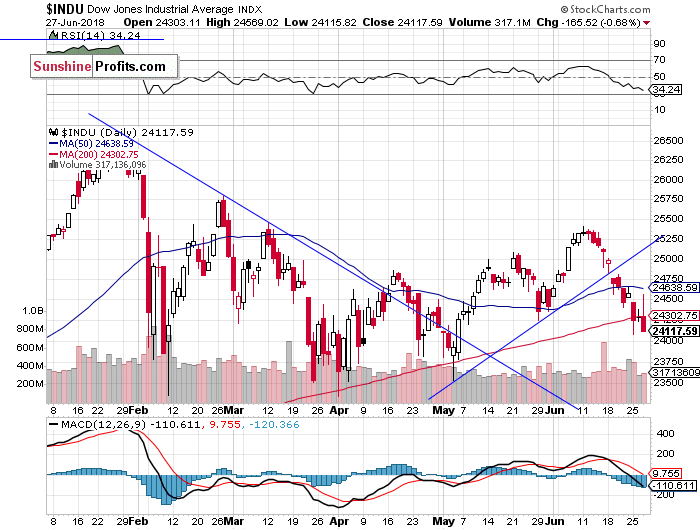
Dow Jones Below its 200-day Moving Average
The Dow Jones Industrial Average broke below its two-month-long upward trend line more than a week ago. Then it continued lower, as it fell below the level of 24,500 on Thursday. The blue-chip index accelerated its short-term downtrend on Monday. There is a potential support level at around 24,000-24,250, but the market seems to be breaking below its 200-day moving average:
The S&P 500 index fell the lowest since the end of May on Monday. Then it rebounded slightly on Tuesday. Yesterday it came back to the level of 2,700. Is this a new downtrend or just downward correction within the medium-term consolidation? The market may extend its decline, but there is a potential level of support of around 2,700. We may see some short-term uncertainty here. There have been no confirmed positive signals so far.
Concluding, the broad stock market will likely open slightly higher today. Then the S&P 500 index may continue to fluctuate along the support level of 2,700. If it breaks lower, we could see more selling pressure. For now, it looks like a downward correction within the medium-term consolidation.
If you enjoyed the above analysis and would like to receive free follow-ups, we encourage you to sign up for our daily newsletter – it’s free and if you don’t like it, you can unsubscribe with just 2 clicks. If you sign up today, you’ll also get 7 days of free access to our premium daily Gold & Silver Trading Alerts. Sign up today!
Thank you.
Paul Rejczak
Stock Trading Strategist
Stock Trading Alerts
Sunshine Profits - Free Stock Market Analysis
