
This essay is based on the Premium Update posted on November 12th, 2010. Visit our archives for more gold & silver articles.
Now it's official! The yellow metal has gotten the golden seal of approval. This week none other than the President of the World Bank said leading economies should consider readopting a modified global gold standard to guide currency movements. Writing in the Financial Times, Robert Zoellick, the bank's president since 2007, says we need a successor to what he calls the "Bretton Woods II" system of floating currencies.
Zoellick is not exactly calling for currencies to be backed by hard assets again and what he is proposing seems vague, but it seems like this idea of using gold as a fixed reference point is a small step in that direction.
The press has seized on his gold comment with front-page banner headlines even though Zoellick mentioned gold almost in passing as his fifth and last proposal. But the world press has ignored those items focusing instead on his statement about gold.
What can we say? Gold is sexy.
What we find interesting is that a figure of the stature of the president of the World Bank is saying on the record that gold could play some role in a new global currency system. Gold is being spoken about in high places. This underscores an obvious need for discussions on monetary reforms at the highest levels.
Zoellick's views reflect the discomfort that exists with the international system, where China's intervention to hold down the renminbi is blamed by the US and others for contributing to global account imbalances. There is also a growing loss of confidence primarily in the U.S. dollar whose value is expected to fall, especially in the light of the Fed's QE2.
Doubts about the overall monetary system are being felt at all levels. Investors worry that the Fed's move last week to pump $600 billion into the nation's banking system, as well as a surge in borrowing around the world, will undermine paper currencies, making gold a refuge once again. Over the last two months, the dollar has declined 6 percent against its principal peers, but gold has jumped 17 percent.
Pointers from the USD Index and the Stock Market
The quantitative easing step taken last week seems to have had the opposite effect on the USD Index when compared to what was expected. One theory is that there is a belief other markets will follow and become more intensive. Another thought is that since the step was widely publicized, markets had already reacted prior to the actual official announcement. Market bought (here: sold) on rumor and sold (here: bought) on fact.
The short-term chart this week shows that the dollar reached a local bottom precisely at the cyclical turning point. This was also the case last August. Since this rally has been ongoing, gold, silver and mining stocks saw their rally end but prices did not plunge.
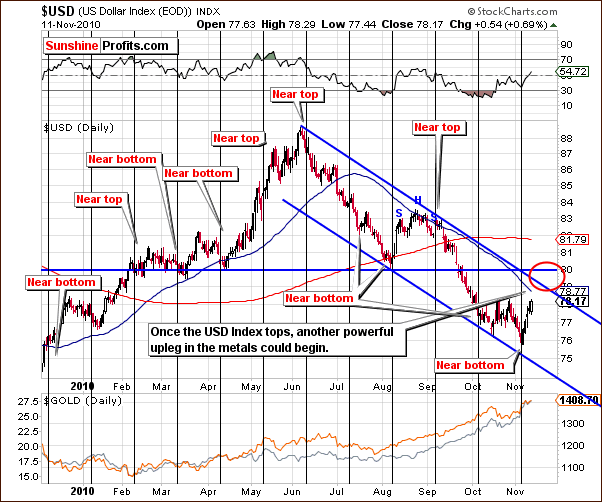
Consequently, once the USD does decline, the rally in the metals could be resumed. The area marked with the red ellipse on the above chart includes what we believe to be the next local top for the USD Index.
The USD Index is relatively close to its local top and therefore a local bottom should be seen soon for precious metals. This may very well provide a good buying opportunity for investors in gold, silver, and mining stocks - we are not there yet.
In this week's long-term general stock market chart, we see that the key 61.8 Fibonacci retracement level has still not been surpassed. This is noteworthy and could impact how quickly stocks move higher from here.
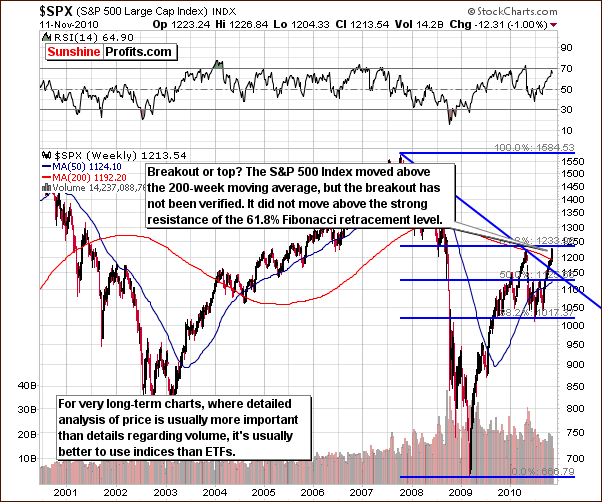
Not much more is seen in this chart but our analysis will continue with the short-term chart.
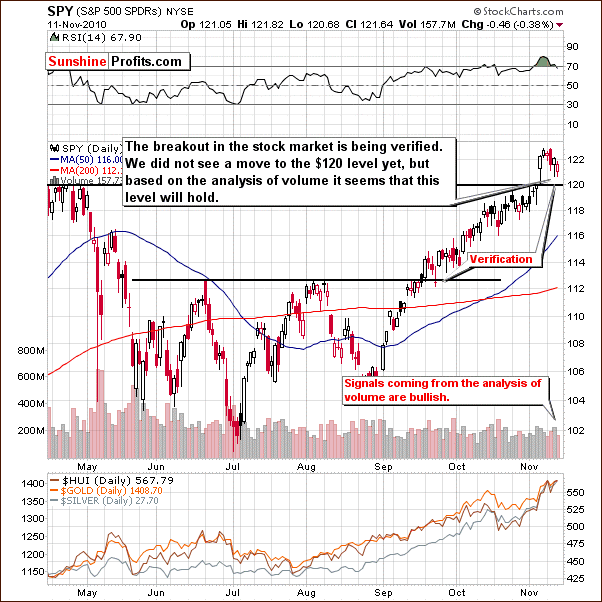
The short-term chart this week shows that volume levels have been relatively low after the $120 level was surpassed. Low volume has accompanied small declines back towards this level although the $120 level has not yet been reached on the downswing. At the same time, the volume was higher during the daily upswing on Wednesday. This leads us to be bullish at this time. Further consolidation is possible but it is likely that the $120 level will hold and provide support.
Breakout or Correction - Which Will Strike?
With the abovementioned influences that USD Index and the general stock market have on the precious metals sector, it is important to monitor the way they could relate to gold, silver and mining stocks' prices. For more details, let's take a look at our correlation matrix.
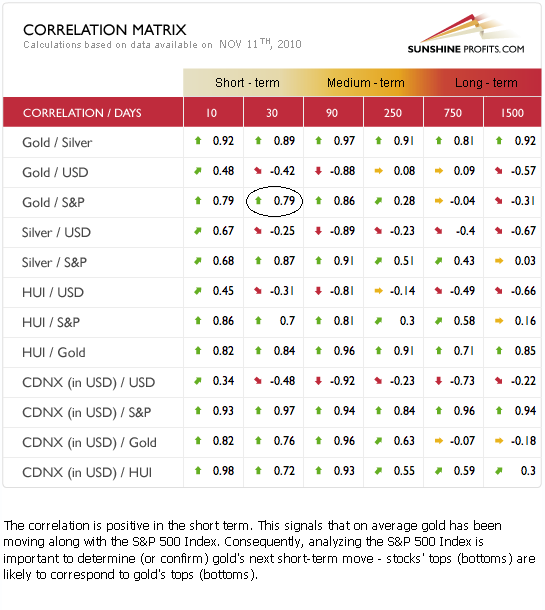
This week we unveil the new, interactive version of our correlation matrix. What you can see here is only a static screenshot, but when you check it out directly in the tools section, and put your cursor over virtually anything within the table, a description will appear at the bottom. An explanation providing definition, importance and implications of each value should make the matrix much more useful than it was previously. That's right - the description changes dynamically, which means that it tells you implications of a particular value of a given coefficient.
You might have noticed that we had put the circle around the correlation coefficient between gold and the general stock market in the 30 days column. This is because we wanted to indicate that the description visible below the table comes exactly from this field. Please note that if the value of the coefficient was much different (for instance it would amount to 0.2 or so), we would display a different comment below the table. It took a lot of work to cover all cases for all pairs of assets for all terms (columns) (it's about 800 combinations that can be displayed), but we believe it was worth it.
Moving to the analysis itself - precious metals continue to be negatively correlated with the USD Index, although to a lesser extent. Gold, silver and mining stocks have held much of their recent gains even as the dollar rallied. It appears that metals have been moving in tune with the general stock market more so than against the dollar and it seems that watching the stocks has become more important recently for precious metals Investors. Consequently, another strong rally appears likely for the metals sector, but a breather first appears likely as well.
The final chart for today is the very-long-term silver chart.
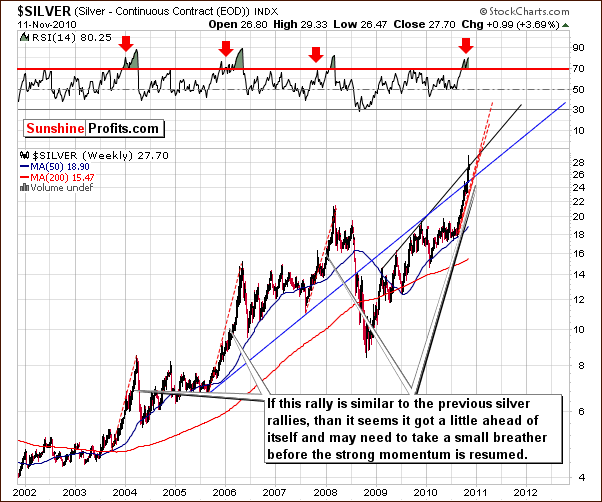
Our first very long-term chart for silver is useful for comparing similar strong rallies over the years for the white metal. It allows us to see the size and pace of past trends and this is quite useful in analyzing current developments. By extrapolating from these prior patterns, we can now profess that silver maybe somewhat ahead of itself. The red, dashed lines have been used to show you how this rally would look like if it was like the previous ones. If this is indeed the case, a period of correction will likely be seen before silver moves even higher.
Ideally a steadier pace is preferred. Silver's volatility frequently leads to situations such as we see today. RSI levels and weekly closing prices confirm the premise that a pause is quite likely very soon as several past trends similar to recent price and volume moves have followed this path. The likelihood is that the local top is quite close and some consolidation will be beneficial to a further rally, which could take silver to new highs (we will leave details regarding the targets to our Subscribers.)
Summing up, the white metal recently tried to breakout above the rising trend channel and failed. This leads us to believe that a pullback is very possible, as the current move above this level has not yet been verified. When historical data is analyzed in conjunction with this current development, a strong case is made for a period of consolidation soon to follow. Similar can be said about other parts of the precious metals sector.
To make sure that you are notified once the new features are implemented, and get immediate access to my free thoughts on the market, including information not available publicly, I urge you to sign up for my free e-mail list. Sign up today and you'll also get free, 7-day access to the Premium Sections on my website, including valuable tools and charts dedicated to serious PM Investors and Speculators. It's free and you may unsubscribe at any time.
Thank you for reading. Have a great weekend and profitable week!
P. Radomski
--
Gold got a 24-carat seal of approval this week when the President of the World Bank wrote that leading economies should consider a modified global gold standard to guide currency movements. He called gold the elephant in the room that can no longer be ignored.
This week, our Premium Update comes with 22 charts, which allow us to visually illustrate our discussion points. Our 5 gold-, 4 silver- and 3 mining stock charts are accompanied this week by additional charts related to the USD Index (2 charts) and stocks (4 charts) as well as the unveiling of our NEW Correlation Matrix. Additionally, we provide 3 charts dedicated to our unique indicators, which have flashed signals recently.
As the impact of the Feds recent QE2 move continues to take shape, market actions, we expect to see more surprises and opportunities to profit if positioned properly. We provide the likely targets (short and long-term) for the gold and silver. Once again, we will continue to sort it all out for our Subscribers and emphasize what to watch for and what to expect in the days, weeks, and months ahead.
We encourage you to Subscribe to the Premium Service today and read the full version of this week's analysis right away.
