

We have long been warning our Readers about doomsayers who spread excessively pessimistic viewpoint and scare investors with the monster of recession. Our thorough analysis suggests - the gold bulls could not like this conclusion - that we have a Goldilocks economy and the current expansion still has room to run.
However, we do not downplay the risk of recession. We are not like many market pundits who express naive optimism that this time is different (we are neither the eternal doomsayers who see writings on the wall everywhere). Instead, we are constantly monitoring economy closely to provide you with the in-depth and data-based analysis.
This month we would like to focus on the money supply, as the pace at which new money is being created in the US (but also in the euro area and in Japan) has recently slowed down. Indeed, as the chart below shows, in late 2018, the American monetary inflation rate dropped below 3.5, the level not seen since 2010.
Chart 1: The weekly M2 money supply growth rate for the US from January 2009 to May 2019 (in %, year-over-year).
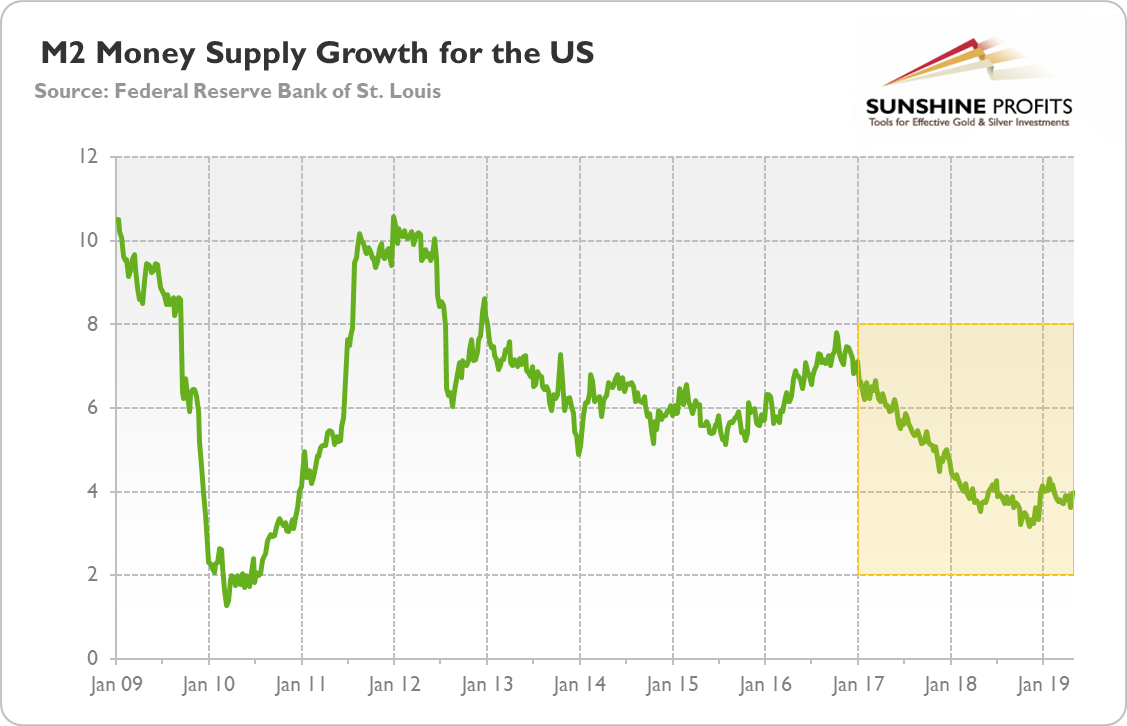
The monetary growth has oscillated around 4 percent in 2019, which is still an unusually weak pace. As the quantity of money in the economy is an important guide to prospect, some market analysts express their concerns about the future economic growth. The slowdown in money supply expansion translates into lower spending, they worry. As the monetary growth is believed to lead financial conditions, the slow rate of money-supply growth increases the risk of recession in the coming months. Indeed, the monetary inflation rate has been below 6 percent since June 2017. Why is it important?
Let's zoom out of the chart. Historically speaking, the 6 percent has been a recessionary threshold. As one can see in the chart, the US monetary inflation dropped below that level before 1990-91 recession, the burst of the dot-com bubble and the Great Recession.
Chart 2: The monthly M2 money supply growth rate for the US (green line, left axis, in %, year-over-year) and gold prices (red line, right prices, London P.M. Fix, in $) from January November 1981 to May 2019.
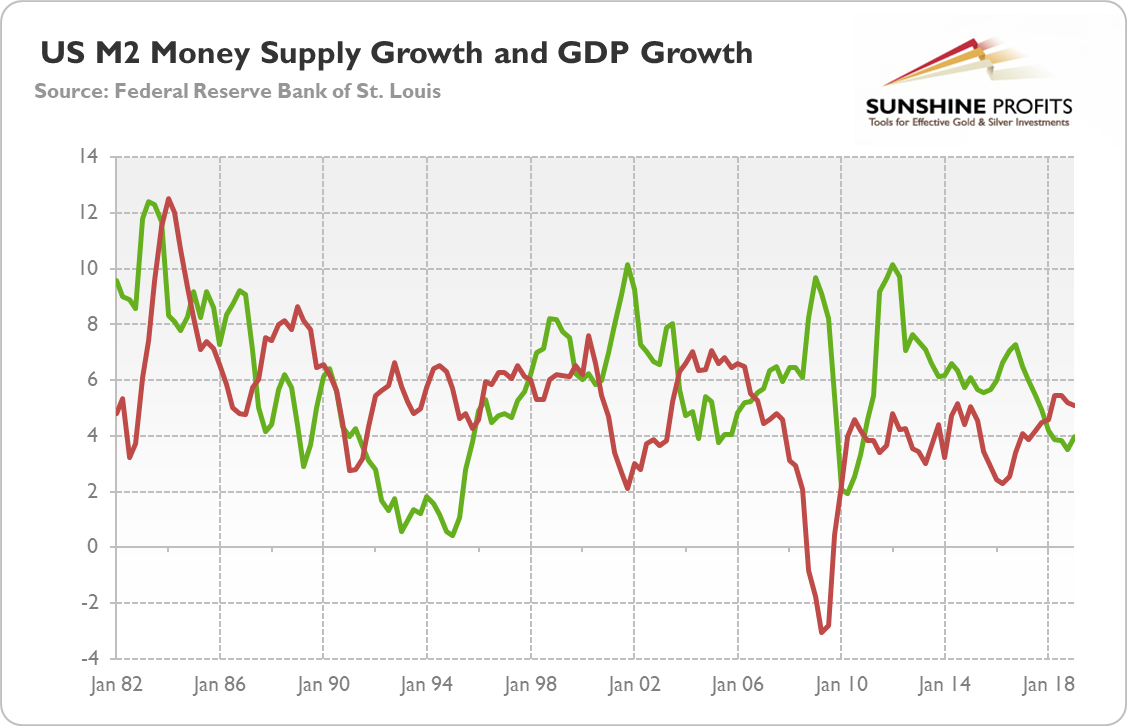
However, the money supply is not the best leading indicator. The slowdown in the monetary inflation occurs long before the economic slowdown - and that time can vary substantially from one business cycle to the next. And it might be actually the case - there is an age-old macroeconomic debate on this - that the money supply lags the economic conditions.
Indeed, just look again at the chart above. Both lines behave similarly, but the monetary growth seems to lag a few quarters behind the economic growth. For example, the former bottomed in the first quarter of 2010, one year after the through in GDP growth. And the monetary growth has been accelerating, not slowing down, in the run-up to the last financial crisis.
It makes perfect sense. During good times, people are eager to take new loans, so the supply of credit accelerates - and so the money supply. Conversely, during bad times, people do not want to take many new loans, so the growth in the credit supply, and thus in the money supply, declines. As Charles Goodhart, a professor at the London School of Economics, once said: "Slowing monetary aggregates is certainly consistent with a slowing economy, but is not the underlying cause."
What does it all mean for the gold market? Well, the sluggish pace of monetary growth is disturbing, and it adds another reason to worry about the recession coming in the near future. If true, gold bulls should like the slowdown in monetary inflation.
However, the moderate growth of the money supply could be just a reflection of the Goldilocks economy (we wrote about it previous part of this edition of the Market Overview), which is neither too hot, nor too cold, but just right. You should not expect strong pace of monetary pumping in economy with steady growth and low price inflation. Therefore, the precious metals investors should not read too much into slowing creation of new money. Indeed, as the chart below shows, the pace of monetary growth does not drive the gold prices.
Chart 3: The monthly M2 money supply growth rate for the US (green line, left axis, in %, year-over-year) and gold prices (red line, right prices, London P.M. Fix, in $) from January November 1981 to May 2019.
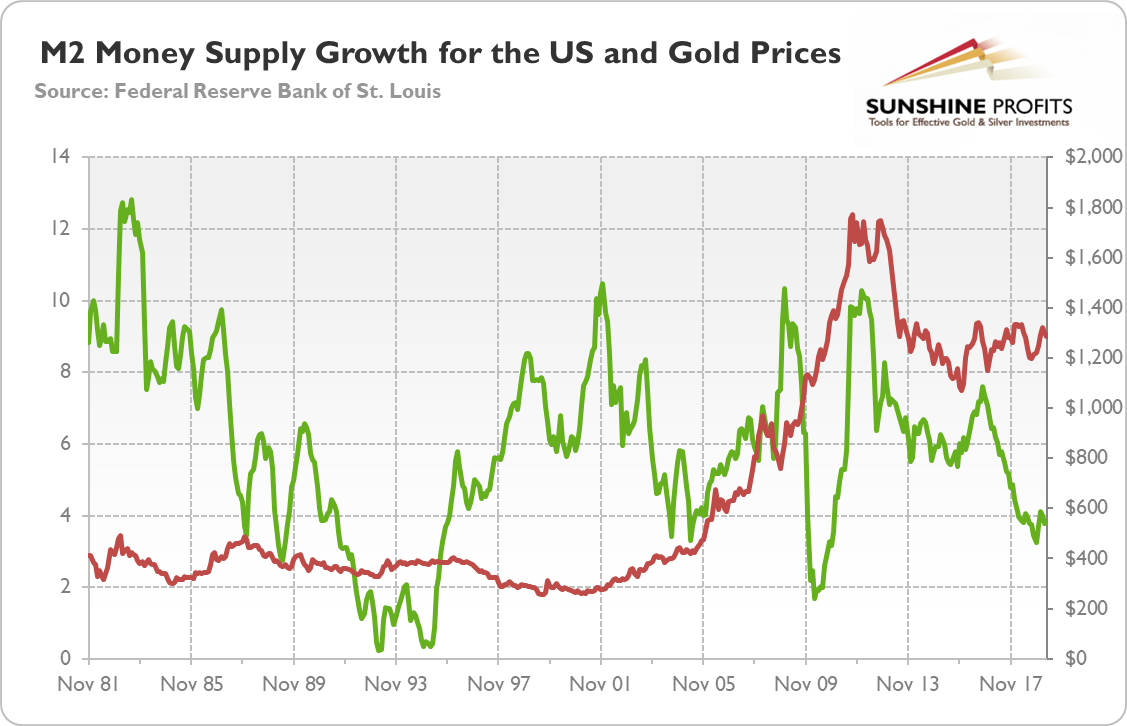
Hence, the casual link between money supply and the real economy is not determined, while the correlation between the growth of money supply and gold prices is clear - see the chart above - and amounts to almost zero.
If you enjoyed the above analysis and would you like to know more about the economics and gold, we invite you to read the June Market Overview report. If you're interested in the detailed price analysis and price projections with targets, we invite you to sign up for our Gold & Silver Trading Alerts. If you're not ready to subscribe yet and are not on our gold mailing list yet, we urge you to sign up. It's free and if you don't like it, you can easily unsubscribe. Sign up today!
Thank you.
Arkadiusz Sieron
Sunshine Profits' Gold News Monitor and Market Overview Editor
