

Our intraday outlook is bearish, and our short-term outlook is bearish. Our medium-term outlook remains neutral, following S&P 500 index breakout above last year's all-time high:
Intraday outlook (next 24 hours): bearish
Short-term outlook (next 1-2 weeks): bearish
Medium-term outlook (next 1-3 months): neutral
Long-term outlook (next year): neutral
The main U.S. stock market indexes gained 0.2-0.3% on Friday, extending their short-term fluctuations following recent move up, as investors' sentiment remained bullish. The S&P 500 index has reached new all-time high at the level of 2,484.04 on July 27, before reversing slightly lower. It continued to fluctuate last week, as it traded slightly below new record high. The Dow Jones Industrial Average reached new record high at the level of 22,092.8 on Friday, as it remained relatively stronger than the broad stock market. The technology Nasdaq Composite gained 0.2%, as investors continued to hesitate following quarterly earnings releases. The nearest important support level of the S&P 500 index is at around 2,460-2,465, marked by July 19 daily gap up of 2,460.92-2,463.85. The next level of support is at 2,450-2,455, marked by June 19 local high. The support level is also at 2,430-2,435, marked by July 12 daily gap up of 2,429.30-2,435.75. On the other hand, level of resistance is at 2,480-2,485, marked by new all-time high. The next resistance level is at 2,500 mark. There have been no confirmed negative signals so far. However, we can see overbought conditions and negative technical divergences. The S&P 500 index broke above its over month-long consolidation, as we can see on the daily chart:
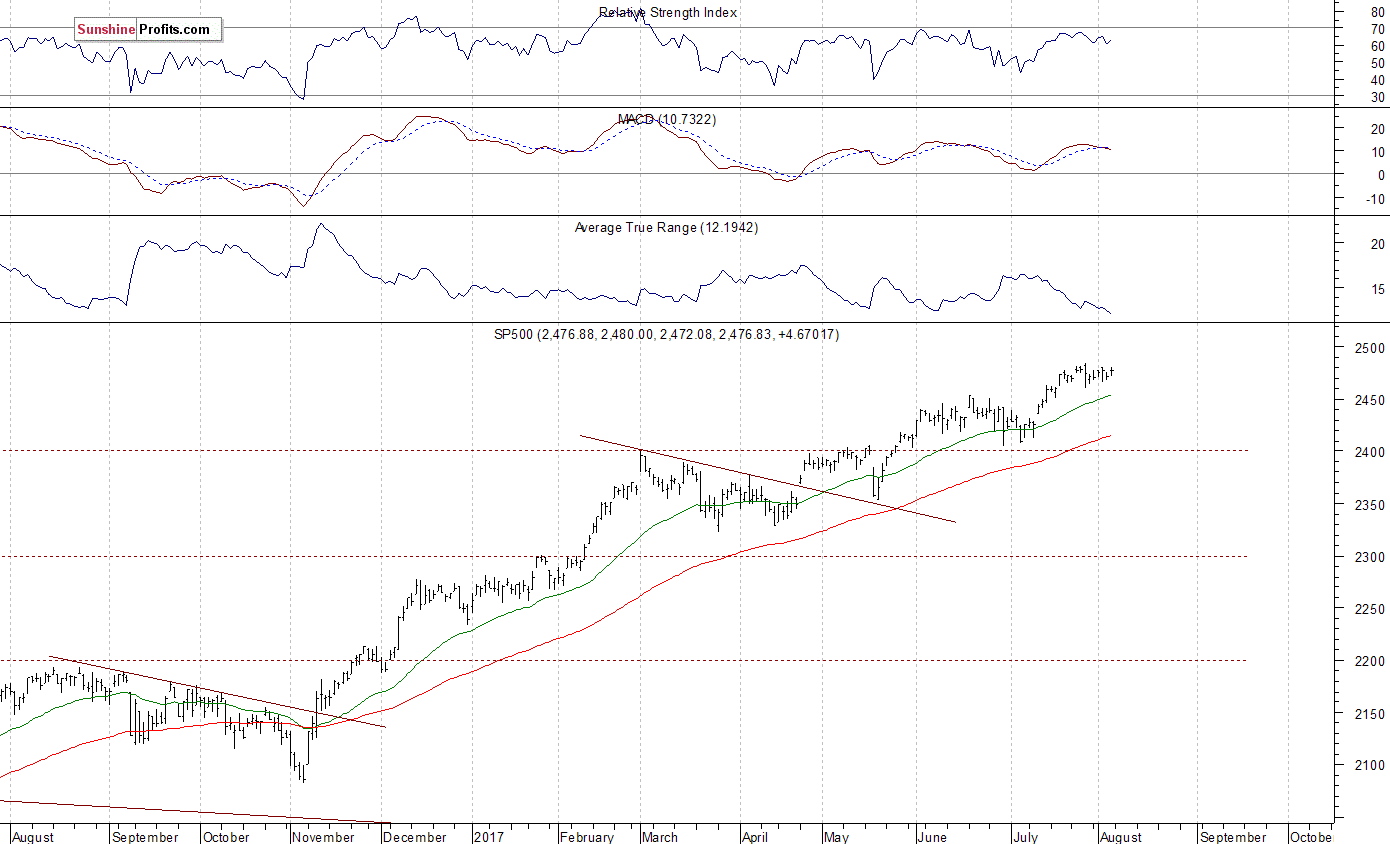
Short-Term Fluctuations
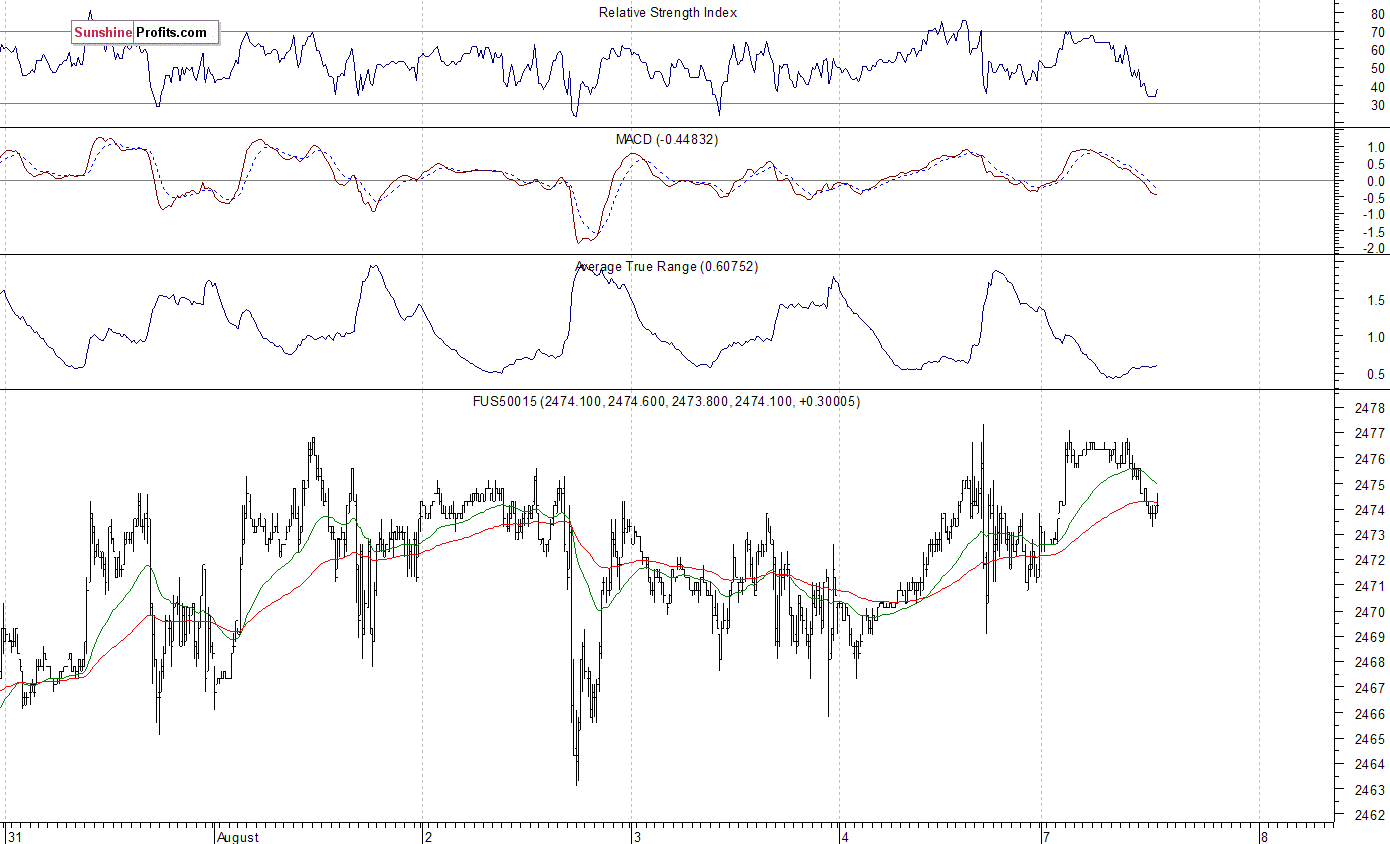
Expectations before the opening of today's trading session are slightly positive, with index futures currently between +0.1% and +0.2% vs. their Friday's closing prices. The European stock market indexes have been mixed so far. There will be no new important economic data announcements today. However, investors will wait for more quarterly corporate earnings releases. The S&P 500 futures contract trades within an intraday downtrend following an overnight move up. The market extends its consolidation along new record high. It remains relatively close to the level of 2,480. The nearest important resistance level is at around 2,480-2,500. On the other hand, support level is at 2,450-2,460, marked by some short-term local lows. The next support level remains at 2,440, among others. Will the market extend its uptrend? Or is this some topping pattern before downward reversal?
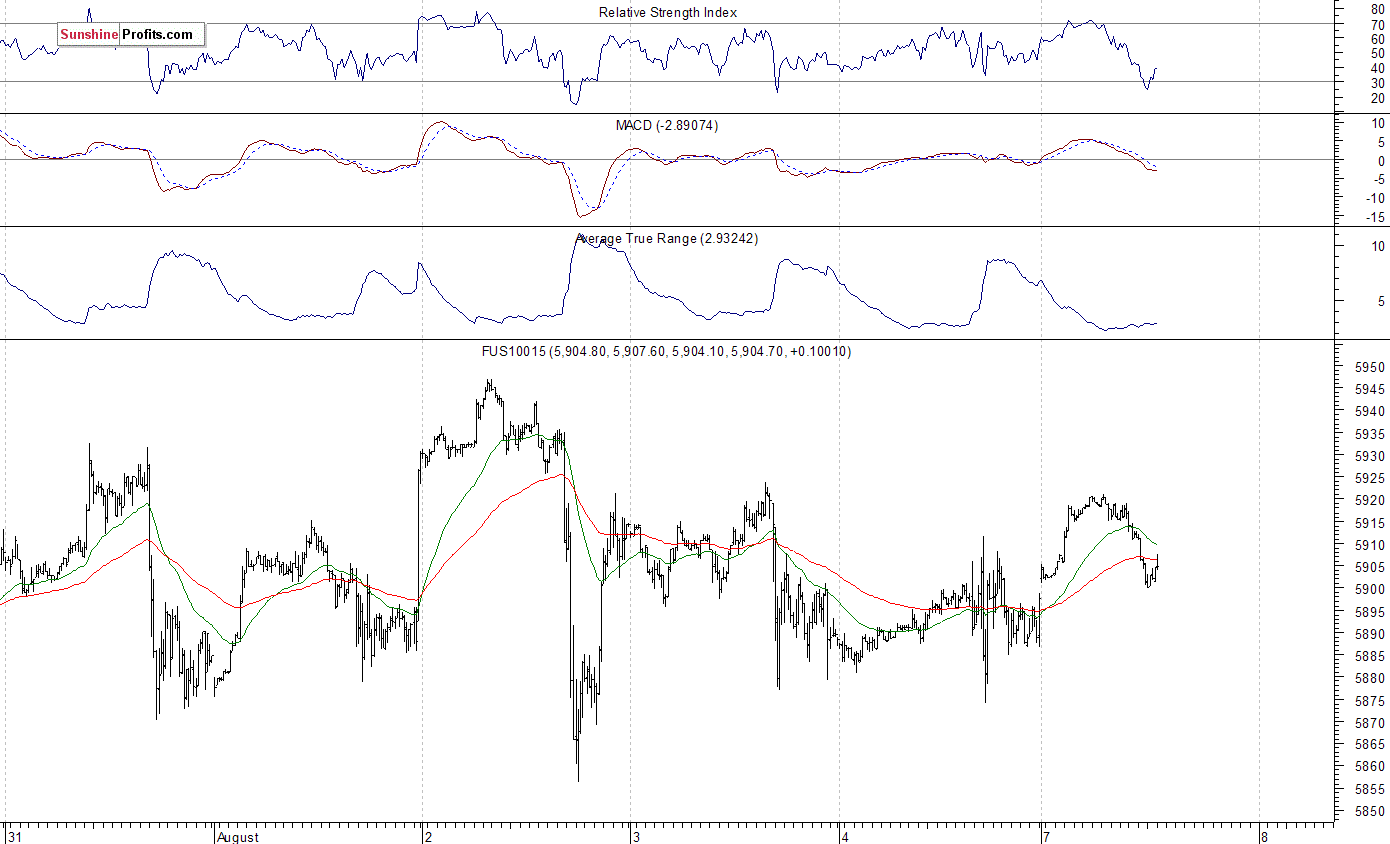
Nasdaq Slightly Weaker
The technology Nasdaq 100 futures contract trades within a similar intraday downtrend, as it retraces some of its overnight advance. The market extends its short-term fluctuations following late July volatility. The nearest important level of resistance is at around 5,950-6,000. On the other hand, support level is at 5,850-5,870, marked by short-term local lows, as the 15-minute chart shows:
Concluding, the S&P 500 index remained close to its all-time high on Friday, as it gained 0.2%. The broad stock market trades just 0.2-0.3% below its July 27 record high. Will the bull market extend even further? Or is this some topping pattern before downward reversal? There have been no confirmed negative signals so far. However, we still can see negative technical divergences, along with medium-term overbought conditions.
If you enjoyed the above analysis and would like to receive free follow-ups, we encourage you to sign up for our daily newsletter – it’s free and if you don’t like it, you can unsubscribe with just 2 clicks. If you sign up today, you’ll also get 7 days of free access to our premium daily Gold & Silver Trading Alerts. Sign up today!.
Thank you.
Paul Rejczak
Stock Trading Strategist
Stock Trading Alerts
