
Yesterday, the S&P 500 Index closed higher for a fifth straight session, posting its best daily performance since the beginning of August, while all 10 S&P sectors ended higher. What factors had such a positive impact on the S&P 500 Index?
Without a doubt, upbeat industrial and retail figures from China boosted optimism about the health of the global economy. Chinese government data showed that exports from the world's second-largest economy rose more than expected in August.
Sentiment among investors was also lifted by merger activity and easing concerns about a potential Western-led strike on Syria. U.S. President Barack Obama said he saw a possible breakthrough in the crisis with Syria after Russia's proposal. Russia proposed to work with Damascus to put its chemical weapons under international control raised the chance that a U.S. military strike would be delayed or averted. However, U.S. President Barack Obama said that he will still continue efforts to convince politicians to back military action.
Syria welcomed a Russian proposal and Syrian Foreign Minister Walid al-Moualem, after talks in Moscow, praised the Kremlin for seeking to "prevent American aggression."
And what has happened with gold and the HUI index in the recent days?
On Friday, gold gained almost 2% after data showed slower-than-expected U.S. job growth in August, even as the jobless rate hit a 4 and a half year low. What’s interesting, at the same time the HUI Index almost didn’t move.
Yesterday, the yellow metal gave up some gains made in the previous session on market expectations that the Federal Reserve may taper its monetary stimulus.
The previously-mentioned Chinese government data and possible breakthrough in the crisis with Syria after Russia's proposal were further bearish factors for gold.
It’s worth noting that the shiny metal is also under pressure from expectations the U.S. Federal Reserve will taper its monetary stimulus program after the Fed's Open Market Committee (FOMC) meeting next week.
In our previous essays we looked at the situation in gold from different perspectives (see the previous essay entitled Gold Price in September 2013). We examined the US Dollar Index, the Euro Index and the gold stocks:gold ratio. We also examined the S&P 500 Index and the HUI Index to check for implications for gold.
Today, we will compare their performance and explain what each of them currently tells us. Let's take a look at the S&P 500 Index chart to find out what the current situation in the general stock market is (charts courtesy of http://stockcharts.com).
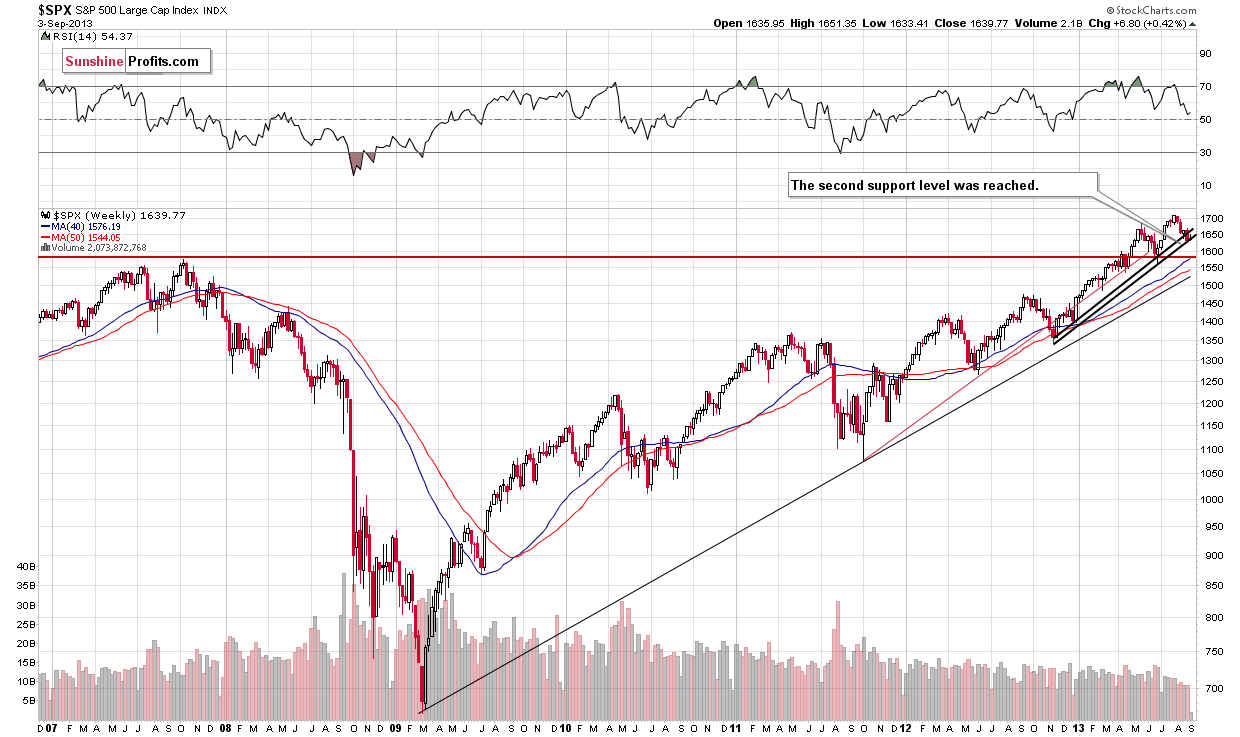
On the above long-term chart, we see that the S&P 500 Index reached the rising support line based on the November 2012 -January 2013 lows (on an intraday basis) at the end of August. This strong support line stopped the recent correction and stocks bounced off it in the following days. As we previously wrote, the S&P 500 Index closed higher for a fifth straight session yesterday. Additionally, stocks broke above the resistance level at around 1,670, marked by the August 26 local top, which is a positive sign.
Technically, the correction is still shallow from the long-term perspective, and the outlook for the S&P 500 index hasn’t changed. It remains bullish.
Now, let’s turn to the financial sector, which used to lead the rest of the general stock market, to see whether the above is confirmed or invalidated.
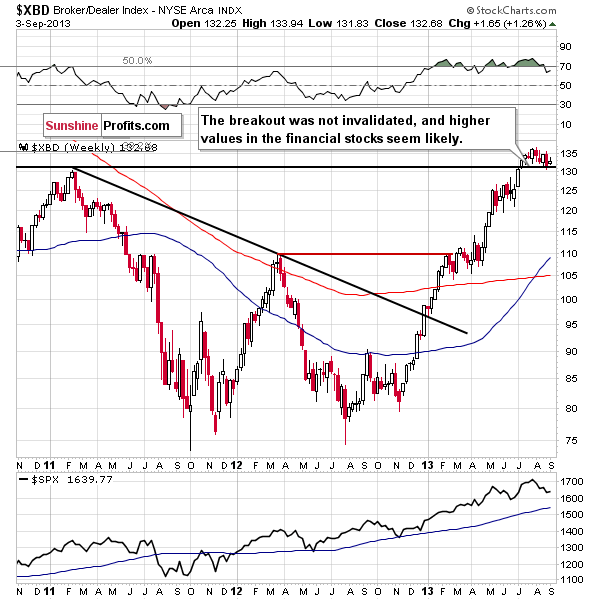
It is confirmed. On the above chart, we see there was a downward move which at the end of August took the financials to the previously broken resistance level of 130. Despite this fact, the financials rebounded sharply last week and are continuing their rally at the moment. Yesterday, we saw their highest value since September 2008. This upward move confirms that nothing has changed and we can still expect further growth in the financial sector and the general stock market.
Once we know the current situation in the general stock market, let's find out what happened during the last several days and check the current situation in mining stocks. Let's take a look at the HUI index.
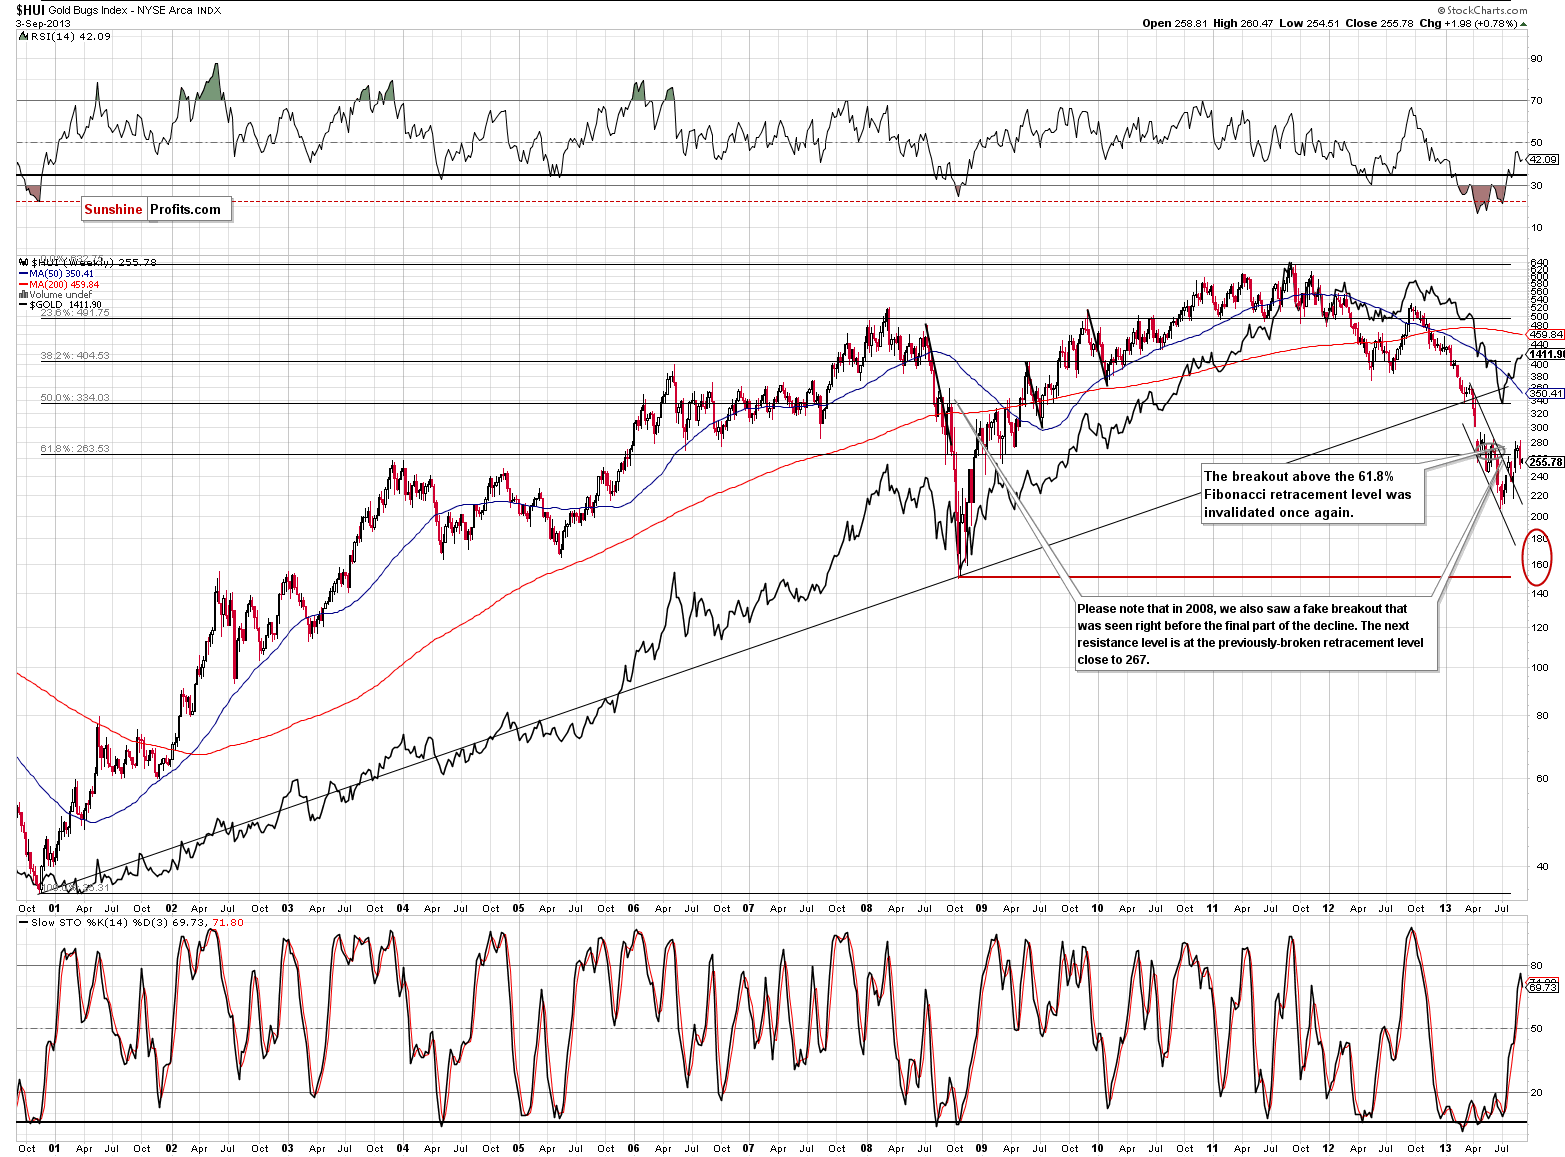
In this week’s very long-term HUI index chart (a proxy for the gold stocks), the situation hasn’t changed much.
As you read in our essay on gold and the dollar on August 28:
(…) we saw several attempts, in the past weeks and months, to move above the 61.8% Fibonacci retracement level based on the entire bull market. (…) they all failed.
In recent days, we saw another failure, and the mining stocks returned to below the 61.8% retracement level (approximately at 267). In this way, the breakout above this resistance level was invalidated once again.
At this point it’s worth noting that the HUI index still remains below this resistance level. Therefore, the implications are bearish and the trend remains down, even though we saw a breakout above the declining trend channel in August.
Having discussed the current outlook for the stock market and the mining stocks, let's move on to the Correlation Matrix and check the relationship between them.
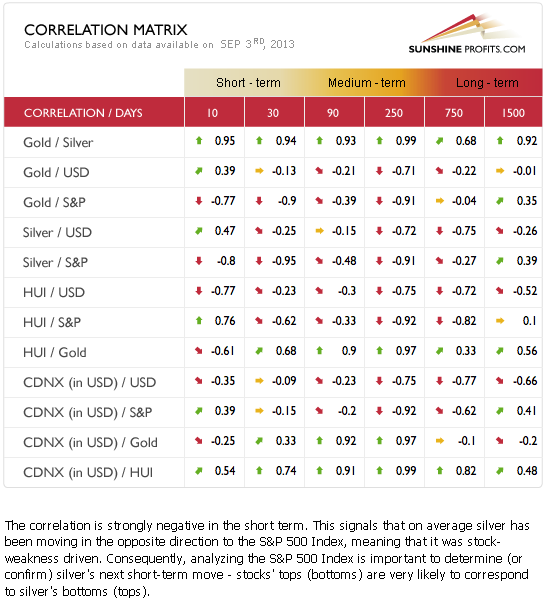
The Correlation Matrix is a tool which we developed to analyze the impact of the currency markets and the general stock market upon the precious metals sector (namely: gold correlations and silver correlations).
Although, the correlation between miners and the stock market has been positive in the recent days, we see that the coefficients based on the previous 30 trading days are negative. This means that gold stocks moved in the opposite direction to the S&P 500 Index. In other words, a short-term rally in stocks would likely trigger a short-term decline in mining stocks.
Summing up, the situation in the stock market suggests that the next move in stocks will be to the upside, especially when we take into account the shallow correction. Thus, the outlook remains bullish. When we take into account the correlation between miners and the stock market, we see that the outlook for mining stocks is considerably negative for short term. The medium-term tendencies are also bearish, because the trend is still down and all attempts to move above the 61.8% Fibonacci retracement failed.
Gold, silver and mining stocks are declining and our subscribers have already gained thanks to the speculative short positions in the sector with carefully placed stop-loss orders. Sign up today and see the details of the positions along with the description (“roadmap”) of the possible ways that the situation could develop this week along with preferred actions for traders and long-term investors. As a reminder, our latest Market Overview report includes detailed discussion of the 8 ways in which the situation in key markets can evolve given different actions from the Fed. The time to access the latest Market Overview couldn’t be better.
Back