
Based on the December 21st, 2012 Premium Update. Visit our archives for more gold & silver articles.
This was a week of declines for precious metals, very strong ones, indeed. It seems that the main culprit was not the U.S. dollar, that should have actually helped the whole sector, as it declined heavily too, but the fears concerning the “fiscal cliff”, that we discussed some time ago, and the lack of any solutions from the government so far. We believe that as soon as the problem is solved, the whole sector will rally strongly. That is even more likely, as gold and silver are currently extremely oversold, as we'll see in the technical part of this essay. To see the true magnitude of the plunge, and try to guess where we can go from this point, we'll have a look at the yellow metal from the perspective of different currencies. But first things first – we'll start with the usual long-term chart of gold priced in USD (charts courtesy by http://stockcharts.com.)
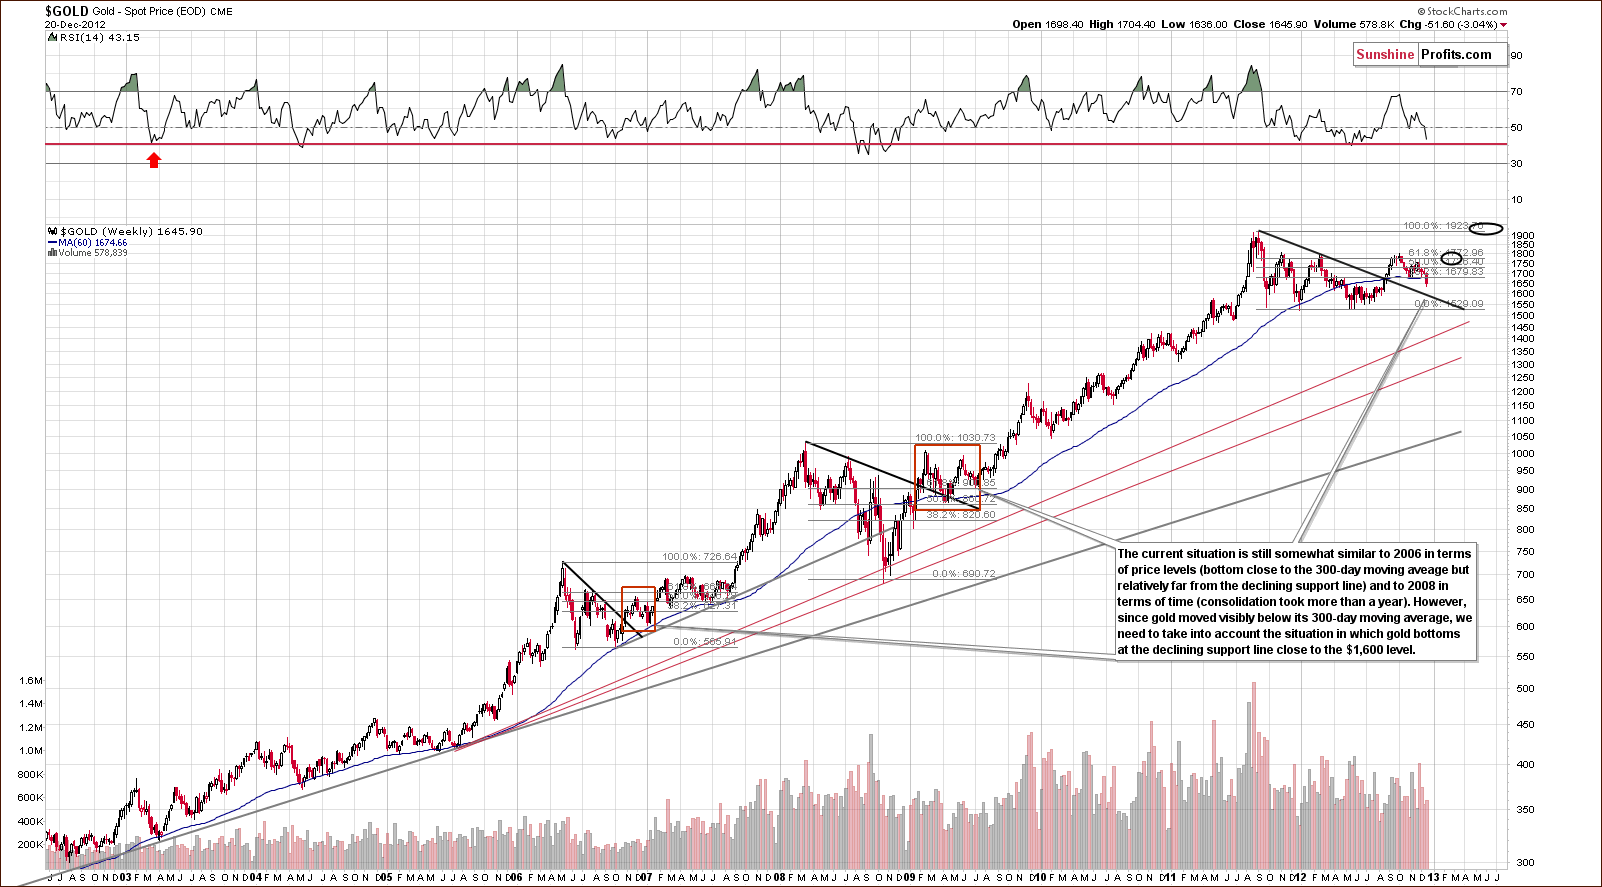
In the chart, we see that prices have moved below the important 300-day moving average (the blue slope in our chart). If prices close the week below this level, which appears likely, then we will have an increased probability of significant declines. If prices do move much lower, it will be a huge buying opportunity and the RSI levels around 40 confirm this. Many times in the past, major bottoms have been seen with the RSI level near 40.
Having seen how the situation looks from the U.S. perspective, let us move on to the first chart of gold priced in other currency, namely in the Canadian Dollar.
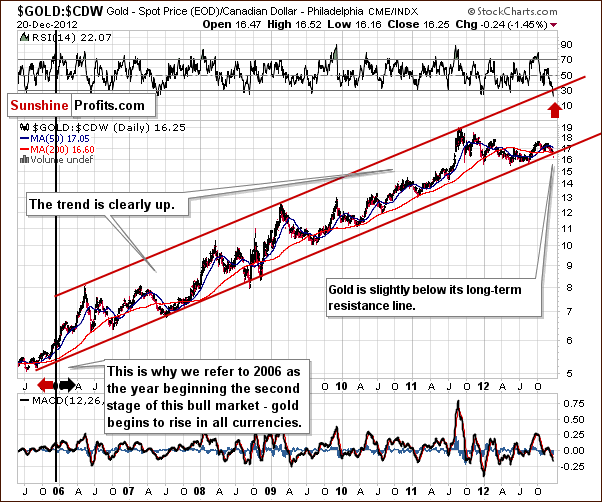
In this chart, we see gold's price has just moved a bit below the long-term resistance line. The move has not yet been confirmed. This type of price move has not been seen since late 2008 but with RSI levels extremely oversold, the bottom seems either to be in already or at least very close.
Now, let's have a look at the yellow metal from the perspective of the Australian Dollar.
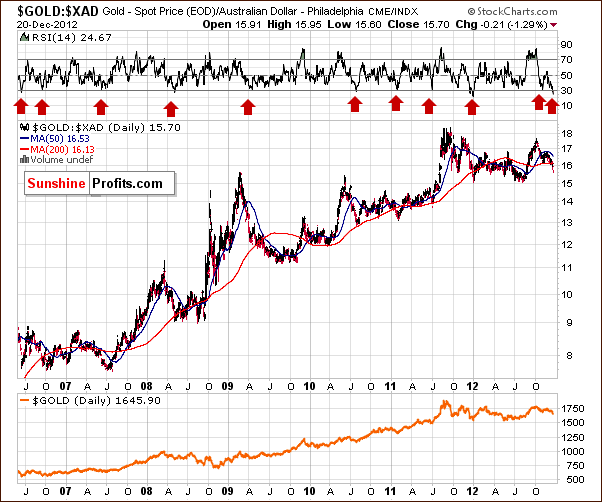
Here, the extremely low values for the RSI are a somewhat bullish sign. This value level has only been seen a few times in past years and each marked a major bottom in gold priced in the Australian dollars.
This is a very long-term chart so a few more days of declines will make little difference. It seems that a medium-term bottom is quite close or perhaps already in.
To finish off, let's take a peek at gold priced in euro.
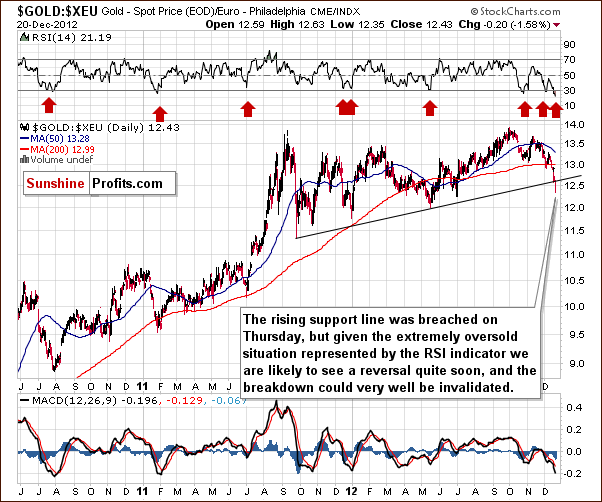
Once again, extremely oversold RSI levels are present in the chart, as they have moved below 30 and are approaching 20 for this ratio. This has not been seen for many years. Gold priced in euro also moved below its rising support line, but this breakdown has not been confirmed, so little weight is placed on this move. It is a bearish development, however.
Before summarizing, here's the question about gold that we received this week along with our reply:
This positive correlation with the dollar is beyond strange and highly unnerving. Is this an indication of some fundamental change in gold? It almost seems impossible. Any light you could shed on why gold now tracks the dollar's every move would be greatly appreciated. This seemsto negate the purpose we entered the PM market in the first place.
We doubt that it's some kind of fundamental change in gold. Why could this be the case fundamentally? Possibly Europeans could be thinking that the worst is over and that the European economy is going to improve in the coming months and are now selling their gold to get back euros. Technically speaking, gold priced in euro is correcting significantly.
The most important thing is to check if we have ever seen anything like this during this bull market or if this is something completely new. And this is precisely what we do when looking at the gold:XEU ratio or gold priced in the euro. There have been times when gold declined along with the dollar and this resulted in sharp declines in the ratio and moves lower in the momentum indicators that are based on it, such as the RSI Indicator. The situation is now extreme and history tells us that the relationship is likely to return to normal very soon.
Another thing that is somewhat related to gold from the non-USD perspective is the SP Gold Bottom Indicator - especially the long-term version. The moment when the indicator moves below its signal line generally corresponds to extremes in the gold-USD link. The indicator is about to flash a buy signal, but it was not yet the case. The suggestion here is that the simultaneous decline in gold and the dollar might to be over just yet.
Summing up, the situation for gold has deteriorated this week. Multiple signals on many charts show the situation to be extremely oversold in the short term, especially from a non-USD perspective. A local bottom is probably close, however, given this week's volatility and the fact that in general oversold assets could become more oversold on a short-term basis before the price trend reverses, we could see additional weakness in the price of gold.
Thank you for reading. Happy Holidays!
Sincerely,
Przemyslaw Radomski, CFA
