

There were not many changes in gold, silver and mining stocks on Friday, and not much has changed in terms of the weekly closing prices either. Gold and gold stocks closed modestly higher, and silver was up by $0.01 last week (after declining $0.01 in the previous week). Some data sources point to $0.02 movement in both weeks, but the overall implication is the same – nothing really happened since gold soared most likely due to Trump’s comments. What can we infer from this silence? Much more than it seems at the first sight.
We previously wrote that the news-based rallies tend to be very temporary and are likely to be reversed. The rally was not reversed yet, but it didn’t continue either. On a stand-alone basis (if nothing else happened other than Trump’s “crazy” comments) that would be a neutral factor with a slight bullish bias as the back and forth trading without a decline would validate the move. But, looking at the performance of the general stock market and still high values of the VIX (stock market volatility index), it’s impossible to say that nothing else is happening. People are still viewing times as uncertain and this is a factor that is likely delaying gold’s decline.
This kind of reaction is most likely only initial. We’ve done the research and we discussed the VIX’s spikes in the previous analyses. The bottom line is that in the vast majority of cases (at least in the recent years), the spikes in stock market’s volatility are excellent shorting opportunities for precious metals. The PMs are likely to move higher only temporarily, and they already did. The next big move should therefore be lower. Naturally, if something unexpected happens that scares the investors, gold’s decline could be delayed even more, but it’s unlikely that such events would keep on emerging. The trend is down, so gold is likely to decline either based on some kind of trigger (for instance based on a breakout in the USD Index) or even without it – when the volatility in stocks declines and people start selling gold as they no longer feel the need to hedge themselves against the risk in the stock market.
Let’s keep in mind that there are already several factors in place that suggest a decline from the current levels. Moreover, we have just seen an additional one.
Mining Stocks’ Signals
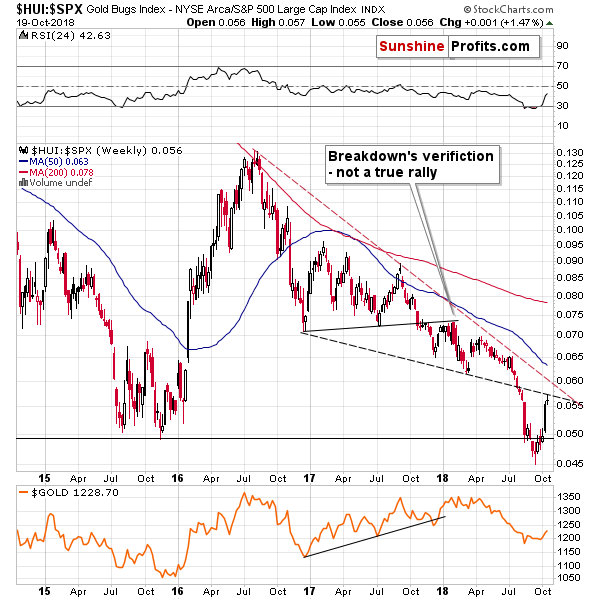
The mining stocks to the general stock market ratio just moved to the declining medium-term resistance line and didn’t manage to break above it. This means that the recent rally was possibly a verification of the breakdown (there is no proof of anything else as there was no invalidation).
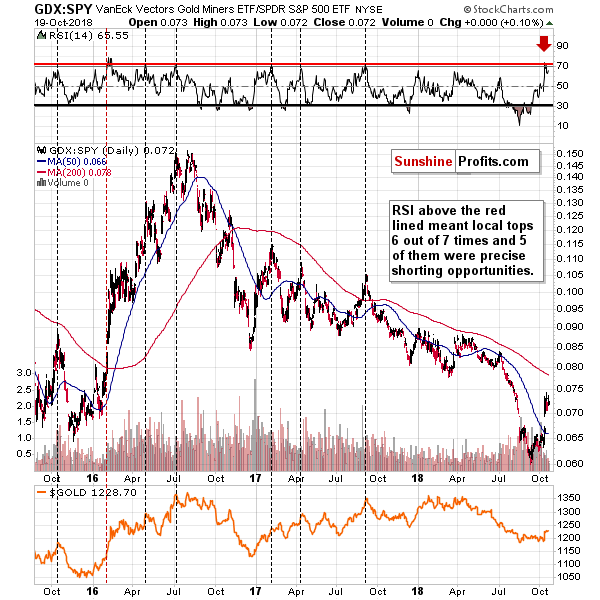
Moreover, on a short-term basis, we have a sell signal from the RSI indicator based on the ratio between miners and other stocks. This signal has been very effective in the past few years, so it’s something that should make one consider opening short positions, not closing them.
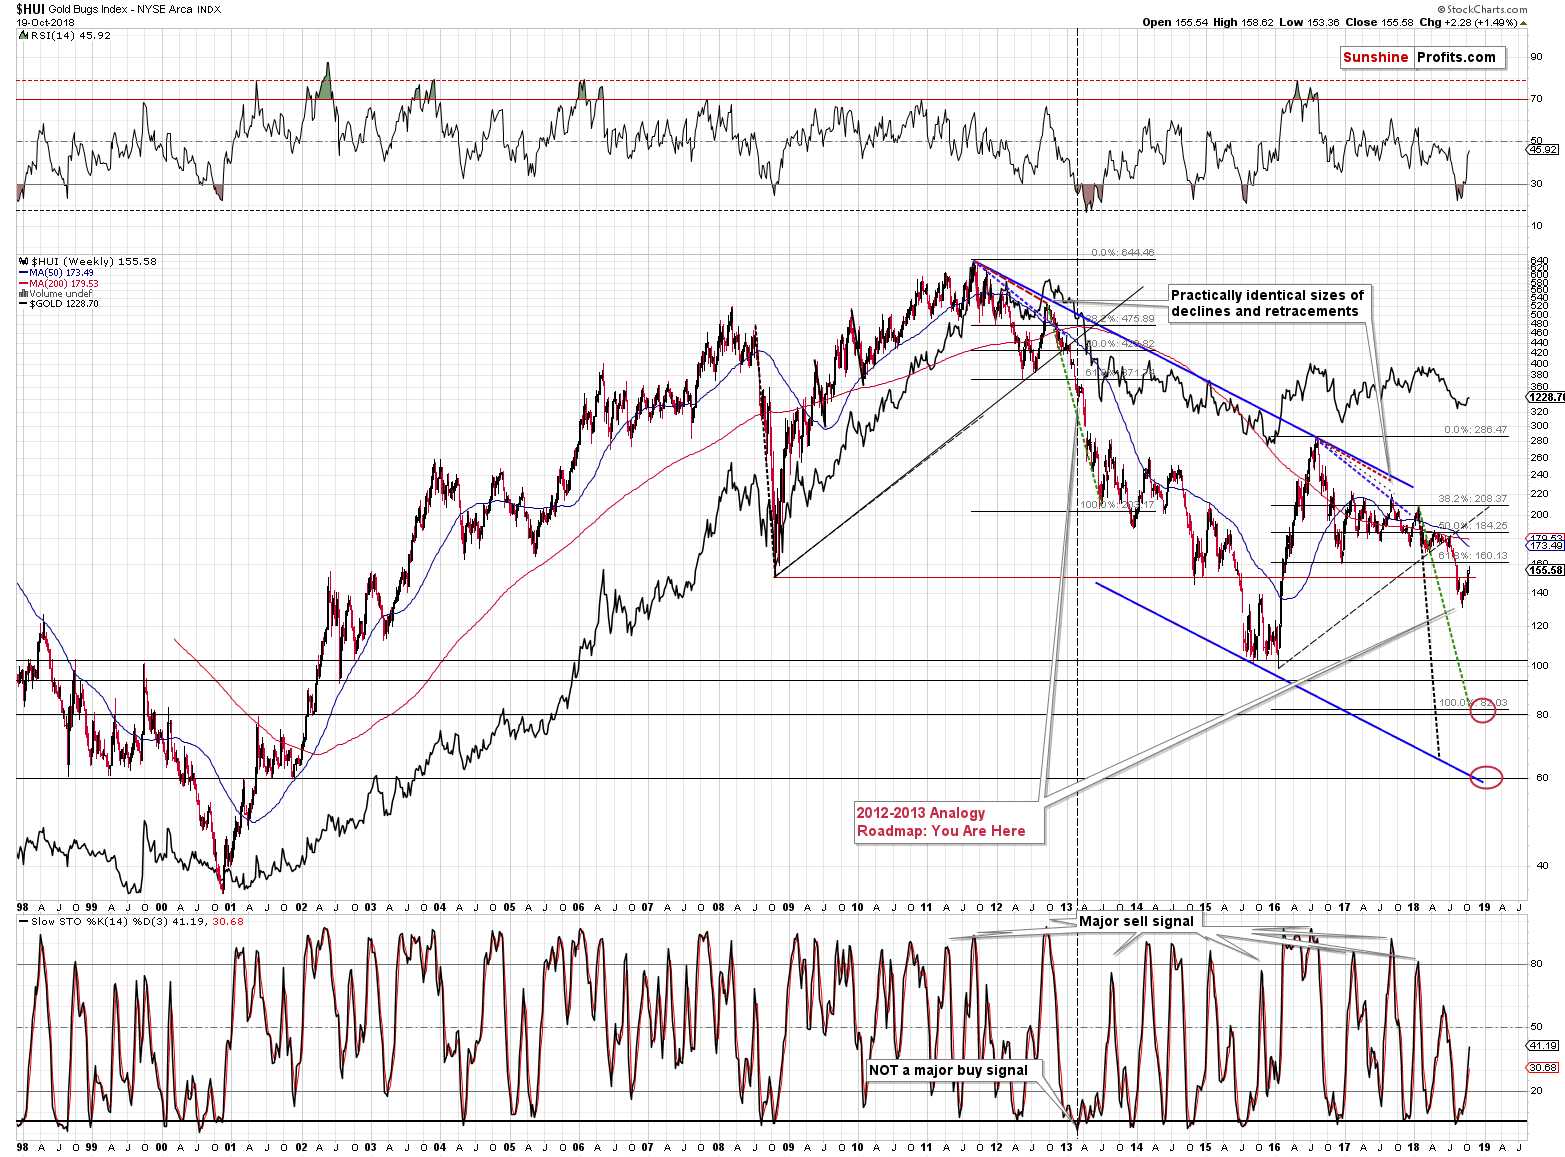
While we’re discussing the mining stocks, please note that the situation that we saw recently is still similar to what happened in 2013 before the biggest part of the decline. Sure, the corrective upswing is now bigger than what we saw in early April 2013, but overall the similarity remains in place. There was no breakout back above the previous lows (late 2016 lows) just as there was no similar action in 2013 (the mid-2012 low).
The new bearish signal that we mentioned earlier, came from a different part of the mining stocks sector – silver stocks.
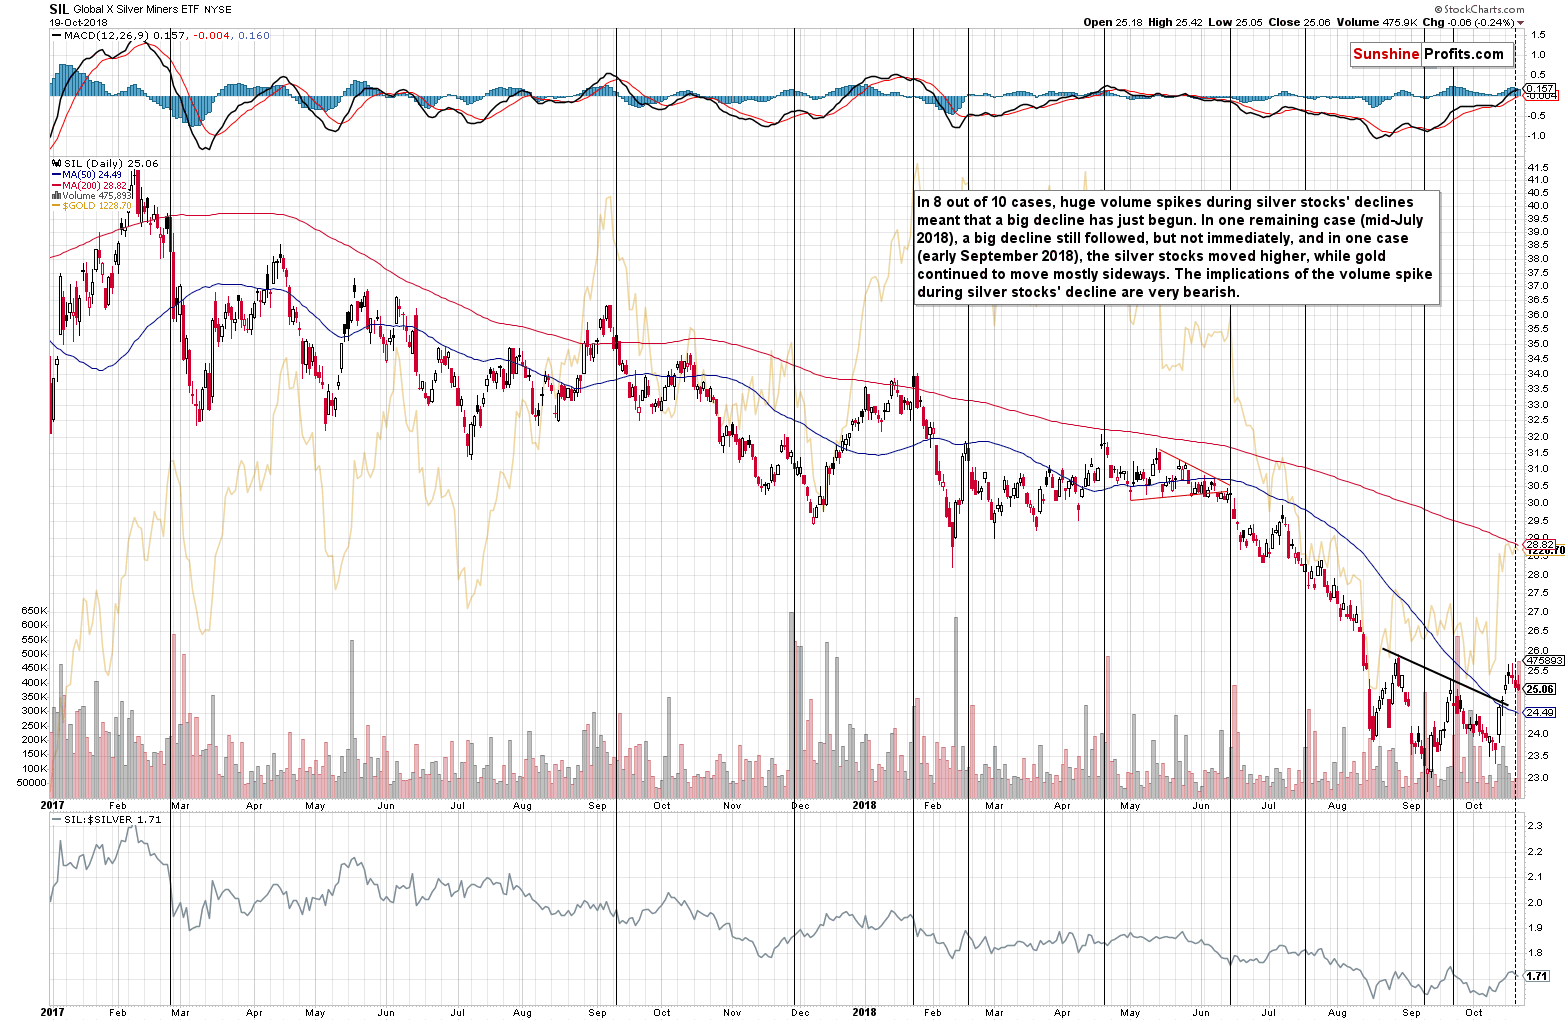
We just saw a spike in the volume of silver stocks during their daily decline. Why is this important? Because in the recent past it almost always meant lower PM prices.
In 8 out of 10 cases, huge volume spikes during silver stocks' declines meant that a big decline has just begun. In one remaining case (mid-July 2018), a big decline still followed, but not immediately, and in one case (early September 2018), the silver stocks moved higher, while gold continued to move mostly sideways. The implications of the volume spike during silver stocks' decline are very bearish.
Let’s stay with silver for a while.
Silver’s Signal and Analogy
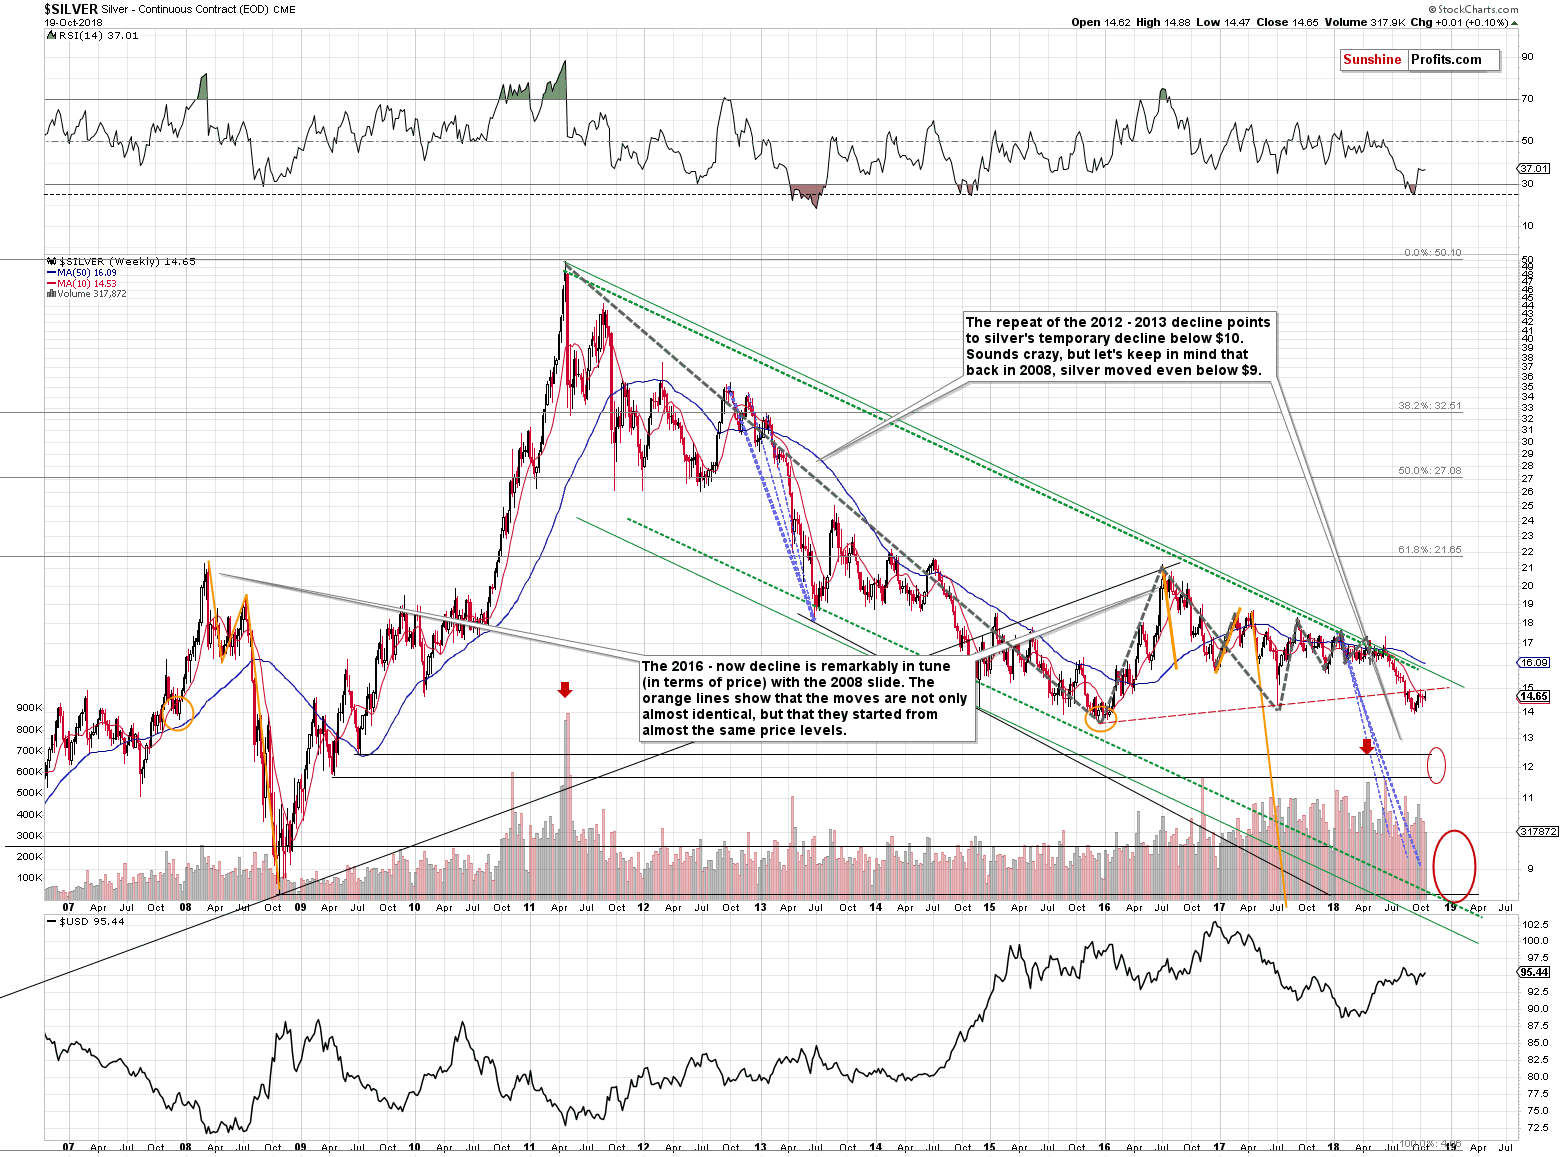
The white metal is after a major breakdown and consolidation below the previously broken line. This factor alone is what makes a sizable decline likely. But the thing that we would like to emphasize is the corrective upswing is what makes the current situation similar to what happened before mid-April, 2013. The current action in silver does not invalidate the current -2013 link – it fits it.
Compared to the price of gold, silver also has bearish implications. In particular, the sell signal that’s based on the pace of the recent quick rally in the ratio.
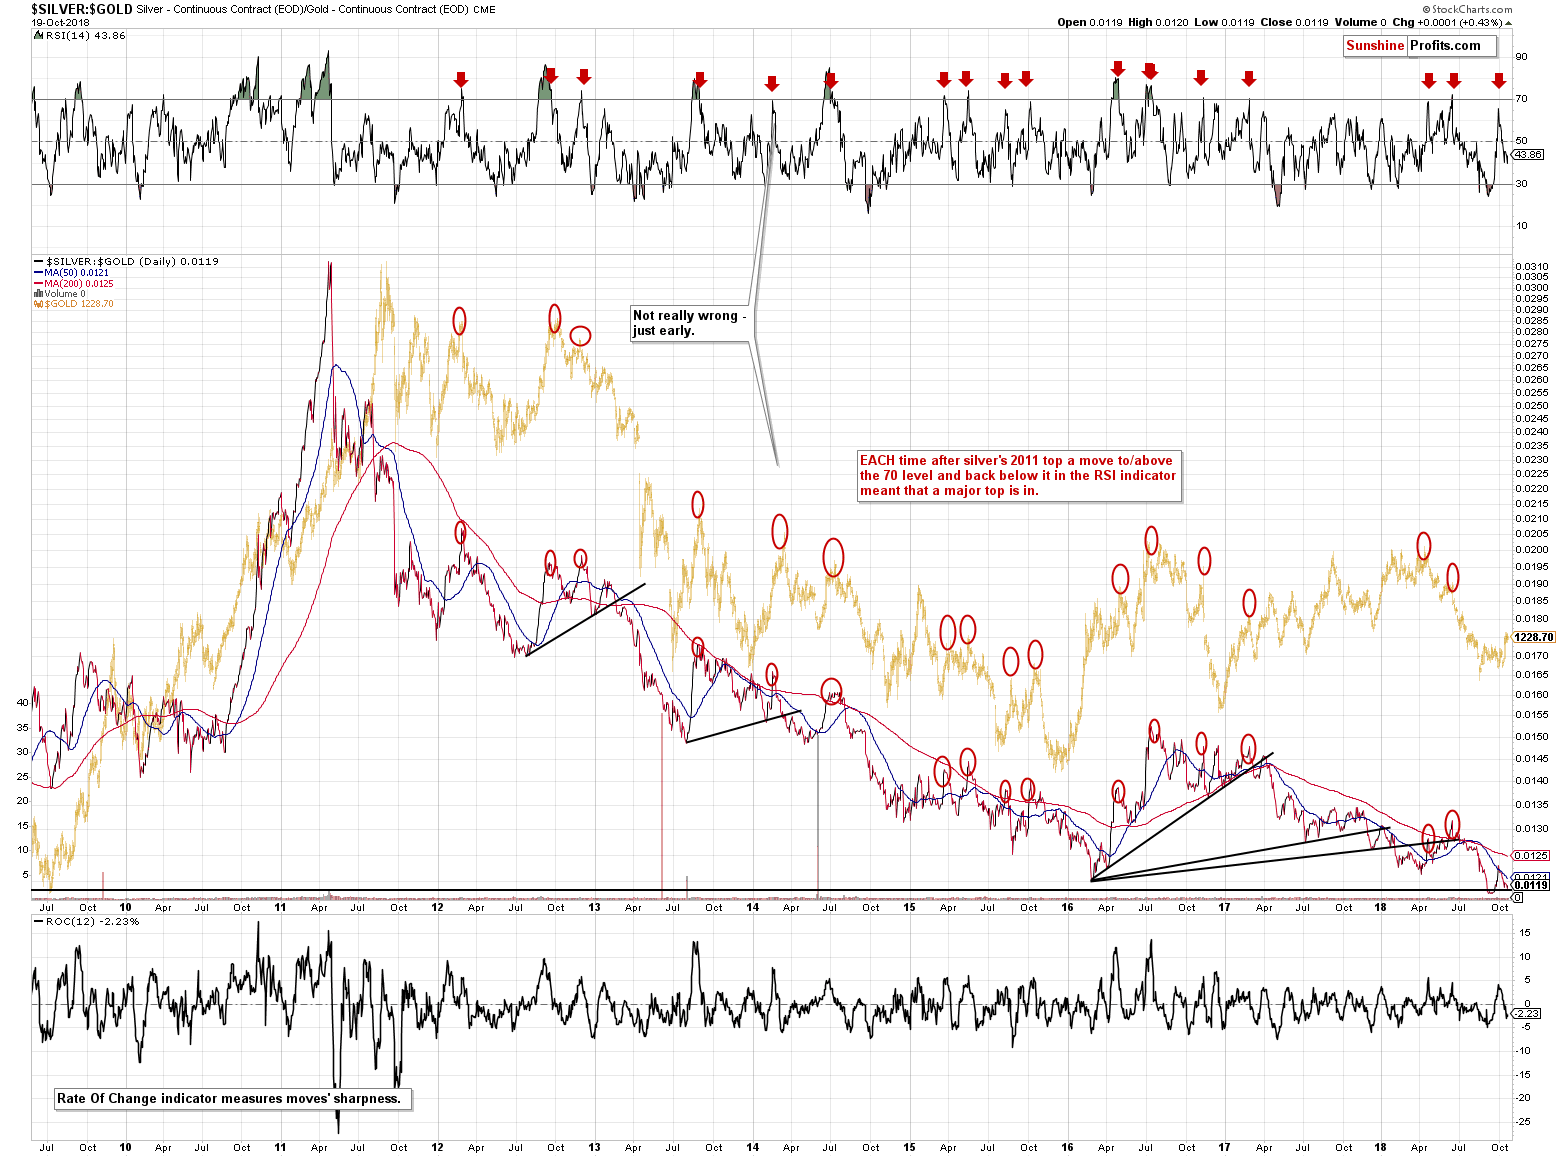
The red arrows mark cases when the RSI was above or very close to the 70 level and then declined. In practically all cases major declines followed, even if they didn’t start right away. This is a very strong indication that the next big move is going to be to the downside, not to the upside.
Gold’s Upcoming Reversal
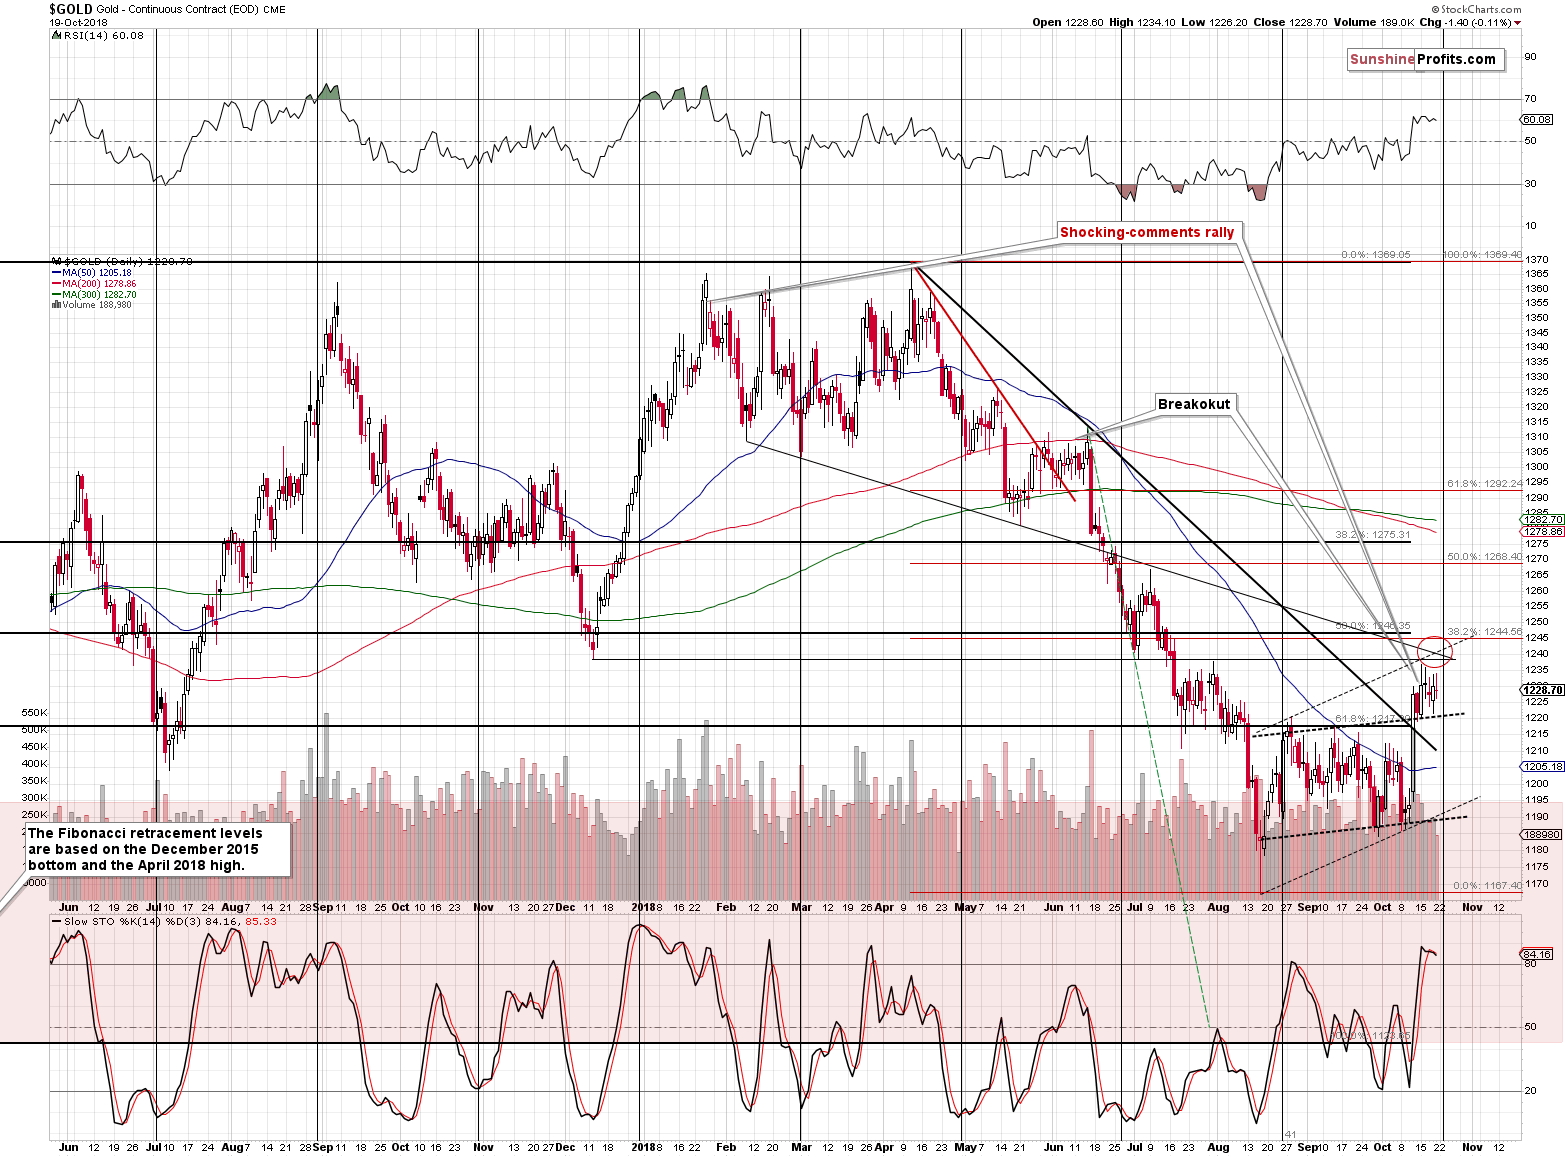
With all the bearish medium- and short-term factors in play, let’s not forget that the next cyclical turning point for gold is just around the corner – on October 24th, which is this Wednesday.
The most recent short-term move was definitely up, so the implications are bearish. Let’s keep in mind that the turning points work on a near-to basis, so we might get a turnaround earlier or a day-two after this date. In short, gold is likely to reverse this week.
What is important, is that despite all the bearish factors, we could still see move a little higher before gold's reversal. It moved very close to our target area, so the top could be in, but we should not be surprised by a move to about $1,240 once again. The target area is based on the declining medium-term resistance line, the upper border of the rising flag pattern, the early July low and the December 2017 low. There are also two Fibonacci retracement levels, including the 38.2% retracement (about $1,245) based on the most recent decline. Reaching this level would also not change the outlook and it’s also something that could happen before the reversal and before the big decline resumes.
Summary
Summing up, the breakout in gold is a bullish development for the short term, but the rally that was likely to be seen based on it, could have already taken place. There are multiple bearish signs in place that confirm that the rally is just a correction within a bigger decline and there are indications that point to a reversal taking place this week.
 Details available to Subscribers only.
Click here to subscribe.
Please note that the above is based on the data that was available when this essay was published, and we might change our views on the market in the following weeks. If you’d like to stay updated on our thoughts on the precious metals market please join our subscribers today.
Thank you.
Sincerely,
Przemyslaw Radomski, CFA
Founder, Editor-in-chief, Gold & Silver Fund Manager
Gold & Silver Trading Alerts
Forex Trading Alerts
Oil Investment Updates
Oil Trading Alerts
