
This essay is based on the Premium Update posted August 8th, 2009. Visit our archives for more gold articles.
The evil nemesis in the 1964 James Bond movie is international bullion dealer Auric Goldfinger who is stockpiling vast quantities of gold. Bond investigates at the request of The Bank of England and soon uncovers a dastardly plan by Goldfinger and Chinese agents to bring economic chaos to the West by irradiating the U.S. gold supply at Fort Knox with an atomic device, rendering it useless for 58 years. This would greatly increase the value of Goldfinger's own gold supply and give the Chinese increased power following economic chaos in the West. Bond dodges steel-rimmed killer hats, overcomes Goldfinger's sexy pilot and saves the day.
Goldfinger could have done very well if he had just waited patiently for 1999, which is when some of Europe's central banks began selling their gold reserves under the first Central Bank Gold Agreement - 3,800 tons of it. We know in hindsight that they began selling at the bottom of the market, around $252 an ounce. Since then the price of gold has almost quadrupled. An astute evil-doer like Goldfinger could have made a fortune just by snapping up all those ingots.
This Friday the European Central Bank confirmed signing another renewal of the five-year agreement to replace the existing pact. They reduced the annual limit to 400 tons, down 25 per cent from the previous level. In the current economic environment the central banks are generally not selling. Rather they are holding on to their gold reserves, a move that could further increase sentiment to the yellow metal, and thus positively influence prices in the long term. Data released by global bullion analysts showed that the banks have not disposed of much gold in the first half of the year under the terms of the current Central Bank Gold Agreement. Compared to last year, the banks' sale of gold in the first 6 months of the year was down by around 73 per cent at 39 tons, the lowest level since 1994.
With even governments becoming more bullish on gold (taking actions, not words into account), the odds that the price of gold will eventually go much above the $1000 level are very high. However, the timing of when this will that happen is a different matter. In order to estimate the most probable outcome, as far as timing is concerned, we need to refer to the charts (courtesy of http://stockcharts.com). Let's begin with gold.
Gold
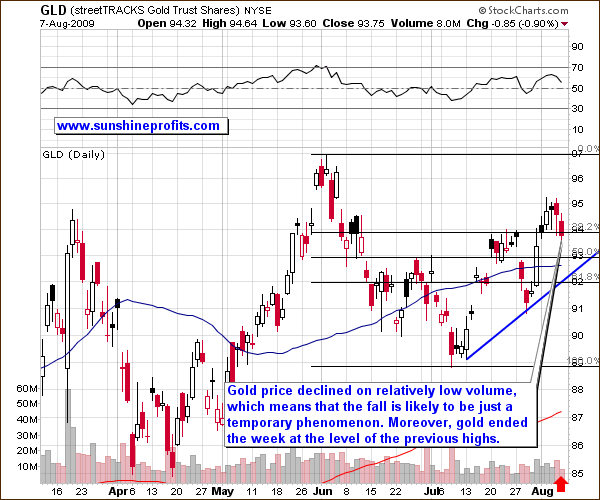
Gold moved higher at the beginning of the week, but corrected these gains at week's end, dented by a stronger dollar. Price stopped at the previous local high, which also corresponds to the 38.2% Fibonacci retracement level of the previous downswing. Normally, one might expect this level to prove a solid resistance. However, this time, gold has already broken above it and closed above three consecutive days, thus confirming the breakout. The resistance level has turned into support.
Another thing to notice is that the volume was relatively low on Friday, which was also the day when price dropped the most. This means that a significant move lower is not very likely. However, should such a move take place, it would most likely be stopped by the rising blue support line drawn from the two previous local bottoms.
Since gold is often purchased as a hedge against erosion in the value of the U.S. dollar, let's take a look at the USD's performance for additional clues.
USD Index
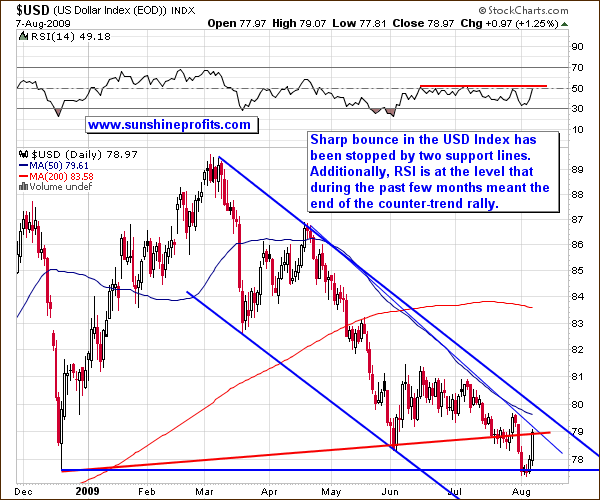
The USD started this week a little lower, but ended with a sizable upswing after reaching the levels that stopped a decline back in December 2008. This large daily move up was stopped by the combination of two resistance lines (red line, and thin, blue line).
Last week I mentioned that the USD gave a bearish signal as it broken out of the declining trend line (false breakout), and plunged almost immediately. This week, the USD moved below the June lows, and then even lower to the 78 level, before moving higher. This makes last week's signal less significant. The general rule is that absent a decisive technical development, the prices of assets tend to resume their previous trend, which - in the case of USD - is down. Going forward, the risk of a rally is larger than it was a week ago, but we need to take additional factors into account.
We examined both charts independently, now let's compare them. Please note that the USD Index moved up more than 50% of its decline during the past ten days, whereas gold moved lower only about 25% of its gains during that same time.
Since the USD Index is generally considered the key driving force for gold prices, the fact that gold is not declining fully and proportionally to the dollar's upswing, is positive for the entire precious metals sector. It means that the market doesn't believe the bounce in the USD Index is anything more than a temporary blip. People seem to believe that the dollar's trajectory is similar that of a hammer dropped from the Empire State Building. They are not willing to sell gold if they think the USD's rise is short-lived. Since the attitude towards gold is positive, this positive sentiment can only increase if the USD moves lower. The good news is that gold would likely move higher with much greater force than the corresponding decline in the dollar.
Summary
The fundamental situation in the precious metals market justifies a move above the $1000 level, as does the size of the correction that followed the initial breakout above the four-digit barrier. Still, despite the previous bearish signals, the situation in the USD market has become murky, and consequently, makes specific calls for the PM sector very risky. The precious metals themselves are showing strength, but if the USD will move higher from here, the PM's rise could be delayed.
To make sure that you get immediate access to my thoughts on the market, including information not available publicly, I urge you to sign up for my free e-mail list. Sign up today and you'll also get free, 7-day access to the Premium Sections on my website, including valuable tools and charts dedicated to serious PM Investors and Speculators. It's free and you may unsubscribe at any time.
P. Radomski
--
This week the dollar moved higher, but gold declined only half as much during the same time-frame. Generally, this is bullish news for the entire precious metals market. The fundamental situation justifies a move above the $1000 level. Still, we must proceed with caution as the situation in the USD market has become vague, making specific calls for the PM sector very risky. The main stock indices are still overbought, which is once again important factor, when estimating where PMs may head next.
I would like to take this opportunity to remind you that our rankings for senior gold/silver producers are updated on a daily basis. Generally, just by using our leverage calculators you should be able to optimize your portfolio by keeping only the best performing stocks. If you take a look at the holdings of the leading gold investment funds, such as Fidelity Select Gold Portfolio and compare it with our ranking, you'll notice that the leading stocks are similar, but not identical). One of the reasons is that in case of the investment fund this information is updated monthly with a one month lag, whereas we provide you with the latest ranking updated on a daily basis. Please note that our ranking is interactive, which means that you may create one that is best for you - taking into account your risk preferences and preferred investment time-frame. You may access the sample version of this ranking by following this link. Naturally, we provide you with a ranking of silver stocks as well.
Randgold Resources Ltd., which has been featured in the top of our ranking, has vastly outperformed other mining stocks since we first mentioned it in October 2008. This company gained over 230% from its October lows to the June 2009 high.
Back