

The end of the previous week was rich in signals as gold, silver and mining stocks all reversed along with the USD Index. Gold closed the week below the rising support line and the implications should not be ignored even by those who usually focus on fundamentals alone.
Why? Because in the short- and medium term, the important technical developments will shape the price – not the fundamentals. Why should one care? In early 2008 silver was priced above $20 and in late 2008 it was priced below $10, even though the fundamental outlook didn’t change. Similar price swings can make a lot of money for those who pay close attention to what’s going on – but knowing about positive fundamentals is not enough.
In the following part of the alert, we’ll show you what technical signs were available on Monday and Friday (this article is based on our Monday’s and Friday’s Gold & Silver Trading Alerts - we had opened short positions in metals and miners on Friday) that warned about the looming slide.
Let’s take a look at the charts (charts courtesy of http://stockcharts.com).
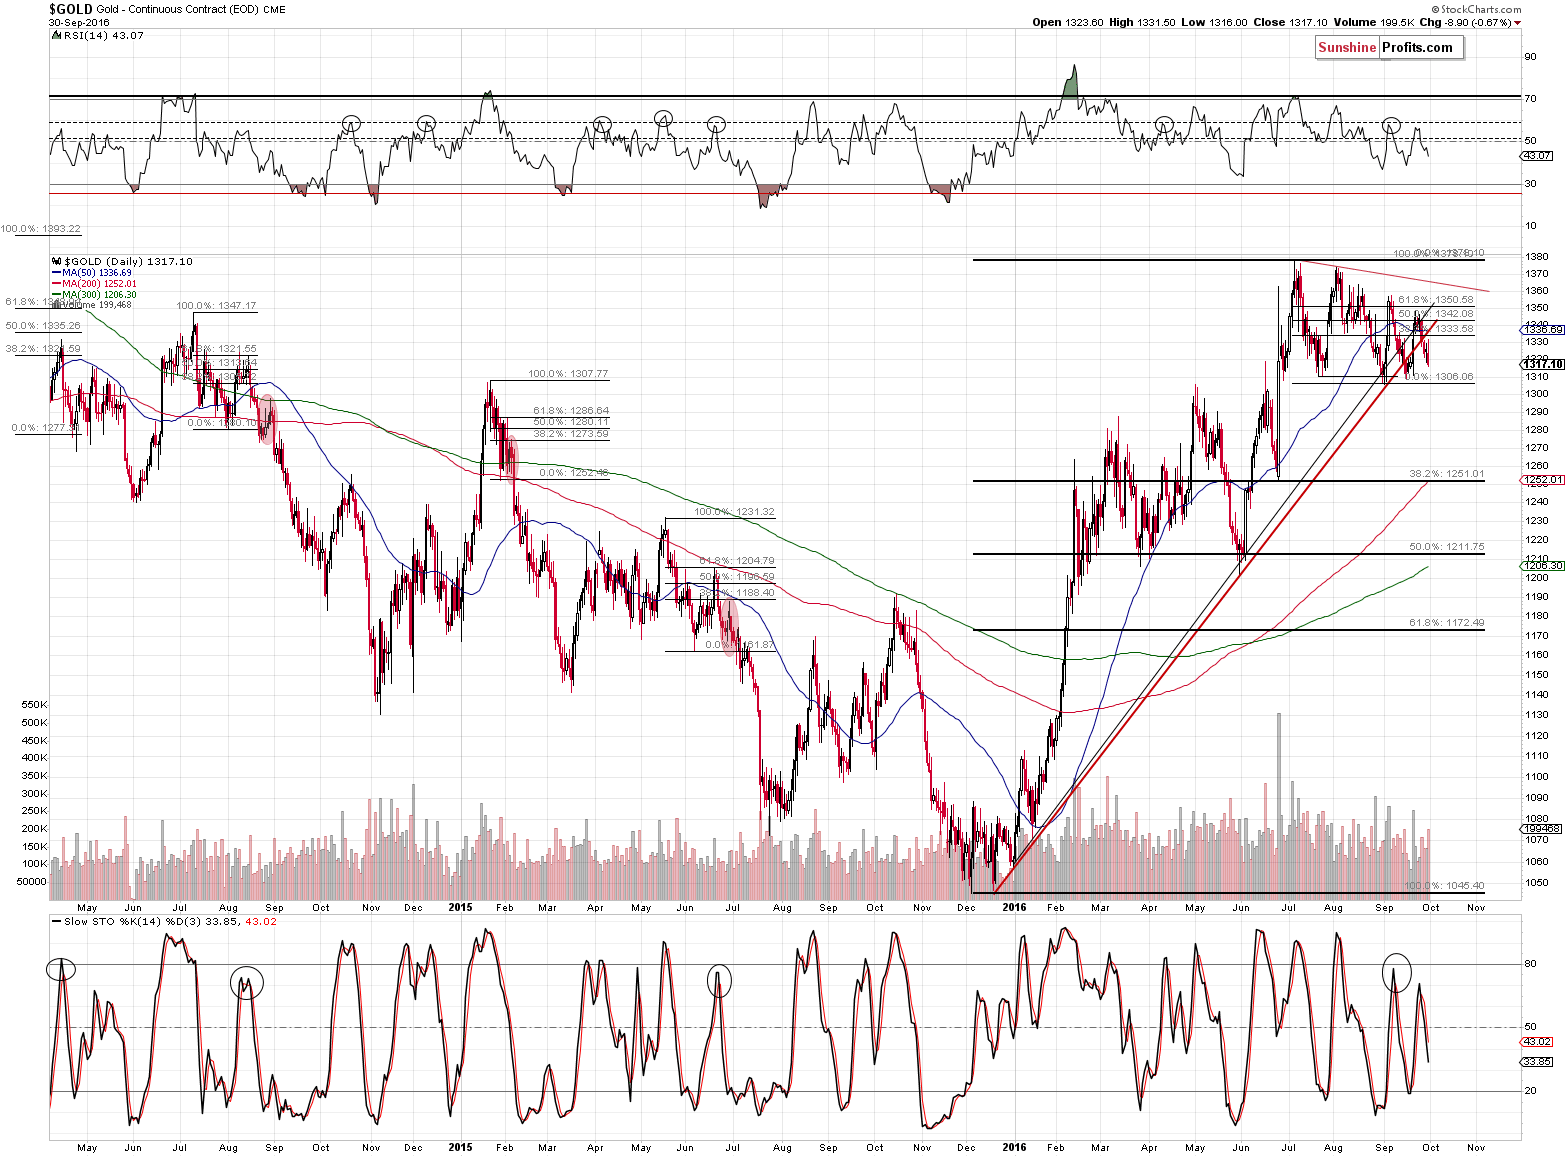
As indicated above, gold broke and closed the week below the rising support lines. This may not seem significant on a day-to-day basis (or when one focuses on fundamentals), but it changes a lot from the technical perspective. Technically, the 2016 rally is over. The weekly closing price is very significant and even without zooming in, the breakdown is clearly visible and the volume that accompanied the downswing was significant. The implications are very bearish.
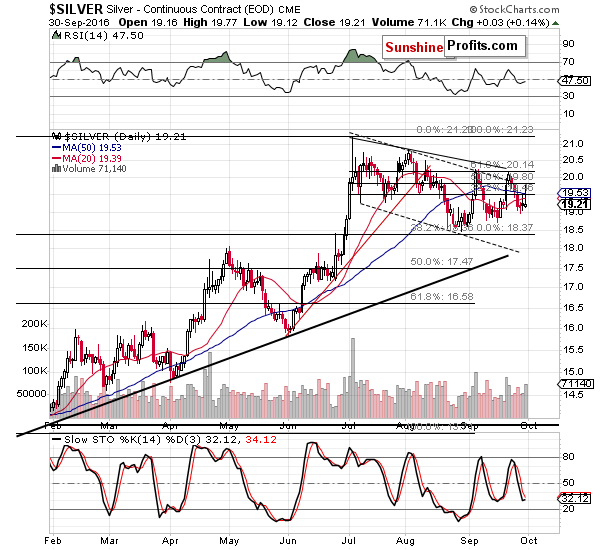
Silver just formed a big reversal and the volume was significant. Actually, the volume alone is the factor suggesting that the top is in – please note what happened after sessions that were accompanied by huge volume in the past. Mid-April, early July, early September, mid-February – all these tops were accompanied by huge volume. The mid-April one was not the final top, but still, it was a good shorting opportunity – silver bottomed over $1 lower than that price after a huge-volume reversal.
In terms of turning points, we get the same bearish implications. It “was about time” for silver to change its course and the thing was that we saw a decline instead of a short-term rally. That was a problem because, in general, the trend remains down, and the implications of the turning point after a decline would be bullish. It all changed based on silver’s intra-day rally. We now have silver after an intra-day rally and it seems that the next move will be to the downside.
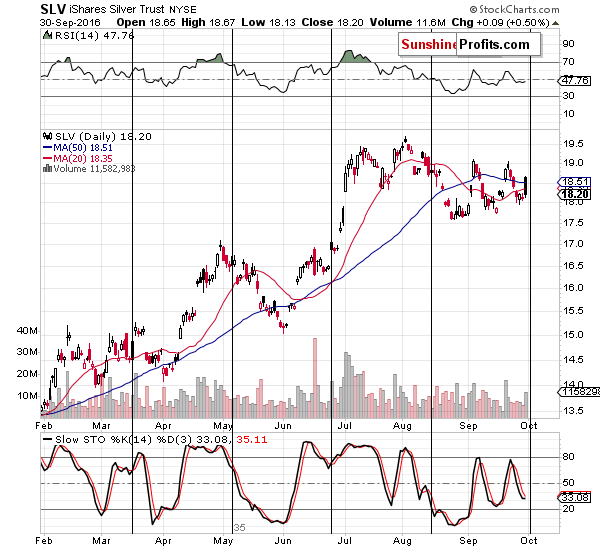
Besides, the intra-day reversals in silver (which is particularly visible in case of the SLV ETF) also have very bearish implications.
Not only did silver rally much more than gold did (on an intra-day basis), but it also reversed in a profound manner. We have been waiting for the bearish confirmation in the form of silver’s outperformance, and the above temporary rally appears to be “it”.
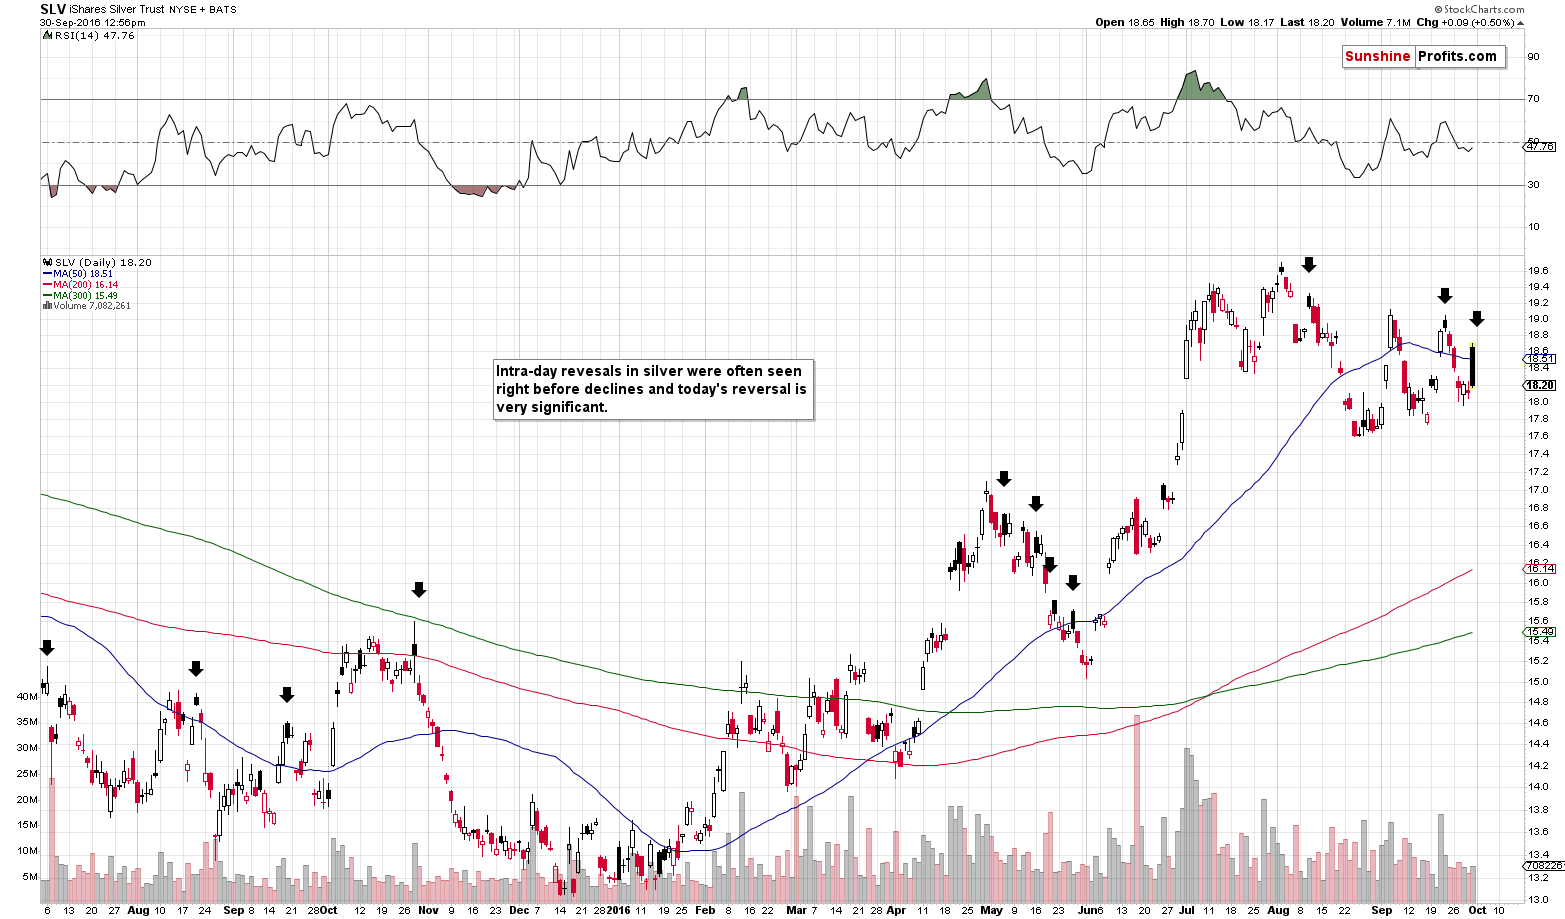
Looking at the above chart alone has meaningful bearish implications as similar intra-day reversals were quite often seen right before declines. We marked the similar days with black arrows. Almost all declines were confirmed in this way before they begun. What does it mean? That the top is quite likely already in.
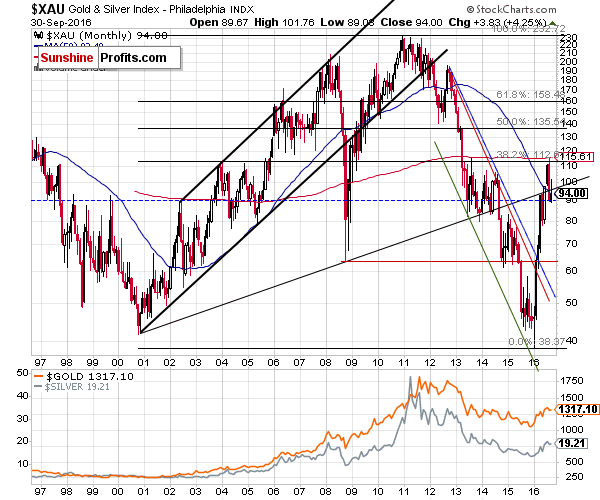
Mining stocks (XAU Index) moved higher last month, but only slightly. The most important thing is that they closed the month below the rising support / resistance line. The implications are bearish as it implies that the temporary move back above the line was a fake one.
Summing up, we had been previously waiting for bearish confirmations and we saw them before Tuesday’s slide. Consequently, based on the above-mentioned factors and as confirmed by today’s move below $1,300 in gold, the bearish medium-term outlook for the precious metals sector became even more bearish (despite positive fundamentals).
Please note that the above is based on the data that was available when this essay was published and we might change our views on the market in the following weeks. In light of today’s major breakdown in gold, it seems that now is a great moment to start a premium subscription.
Thank you.
Sincerely,
Przemyslaw Radomski, CFA
Founder, Editor-in-chief, Gold & Silver Fund Manager
Gold & Silver Trading Alerts
Forex Trading Alerts
Oil Investment Updates
Oil Trading Alerts
