
This essay is based on the Premium Update posted on October 22nd, 2010. Visit our archives for more gold & silver articles.
China is the world's largest producer of gold, but it has plenty of other precious metals and rare minerals as well. Some in the world are already worried about so much power concentrated in one place.
A Bloomberg Report this week stated that silver exports from China, one of the world's largest, may drop about 40 percent this year as domestic demand from industry and investors climbs. China is the third-largest producer after Peru and Mexico. It is expected that reduced exports will boost prices. Industrial applications for silver, including electrical conductors and batteries, represent about half global demand. Silver has rallied 44 percent this year, outperforming gold and copper.
In addition, China, which has been blocking shipments of crucial minerals to Japan for the last month, has also halted some shipments to the United States and Europe. These rare earth minerals are crucial to manufacturing many advanced products such as radar, cell phones, high-powered magnets and mini-hard drives in laptop computers. China's control of them and its willingness to flex its economic muscles seem certain to further intensify trade and currency tensions. The bad news is China mines 95 percent of the world's rare earth elements. If restriction on exports of these minerals continues, it could force multinational companies to produce more of their high-technology goods in China.
The U.S. Congress is considering legislation to provide loan guarantees for the re-establishment of rare earth mining and manufacturing in the United States. Still, it will take three to five years until these new mines reach full production.
China reduced in July its export quota for rare earths for the second half of the year by 72 percent. Exporters had only six weeks' of quotas left when China imposed its unannounced embargo on shipments to Japan.
Speaking of metals with multiple industrial applications, in this week's long-term chart for the SLV ETF (charts courtesy by http://stockcharts.com.) we see that the recent rally appears to have been stopped at the $24-level.
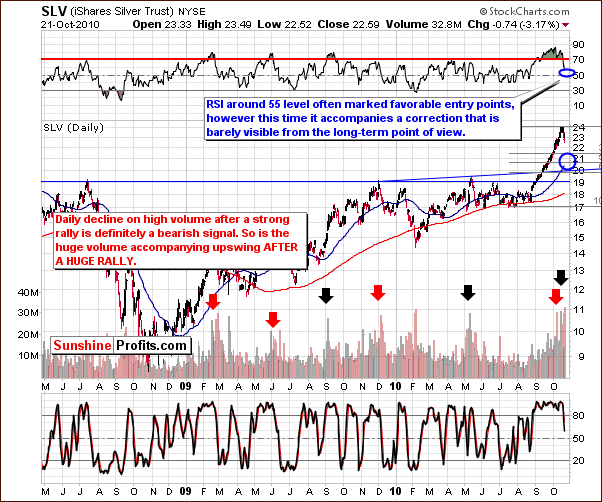
Huge volume levels on upswings after a huge rally is a bearish signal. This was seen in recent days prior to the local top.
Last week, we stated that an RSI level of 55 would indicate a favorable buying opportunity. However, with the bearish sentiment currently in place for the general stock market and gold, the RSI alone is not sufficient to warrant such action. As stated many times in the past, silver's trend frequently follows stocks due to its industrial uses and it follows gold due to its precious side. The trend of the general stock market must also be considered regardless of the indication gleaned from the RSI.
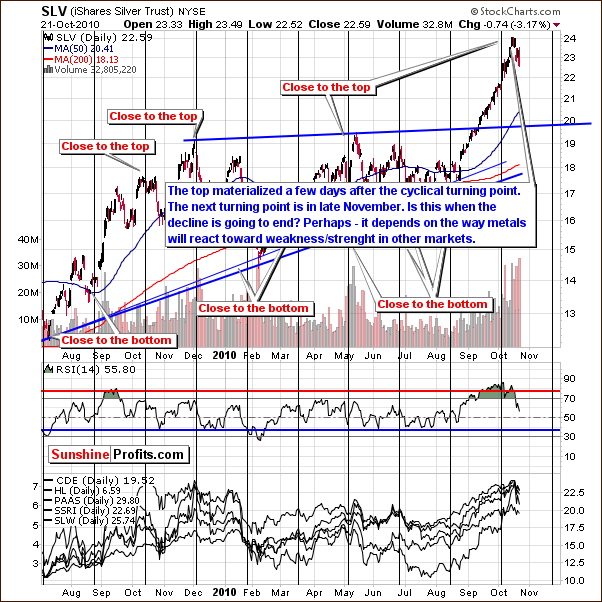
The week's short-term chart shows that, as expected, silver reached a local top a short time after the turning point illustrated by the black vertical line in this week's chart. The next turning point, a local bottom, seems to be about a month away. We expect this will be seen most likely in late November.
Silver's decline could actually be greater than previously projected due to the fact that its recent rally exceeded expectation as well. Its reaction to other markets will likely determine the ultimate bottom for the current downswing. The general stock market trend in the coming weeks will have a significant impact upon how low silver's price declines.
Summing up, silver's price is likely to move higher eventually but numerous indications point towards price declines before we see any rallies in the future.
Having said that, let's move to the analysis of the precious metals mining stocks.
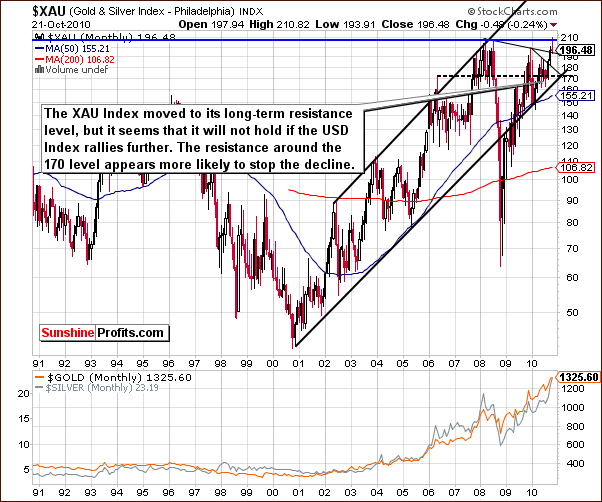
The XAU (gold and silver stocks index) Index failed to break into new highs - as visible on the very-long-term chart above. Although we see it presently at a declining support level, we don't expect this level to hold given declining gold, silver and stock prices.
Support levels such as the lower border of the trading channel, previous local tops, and multi-year support levels are also in play. The declining, short-term trend line has been broken recently most likely due to the USD Index rally. At this point the area around the 170 level appears to be the probable bottom for the current decline.
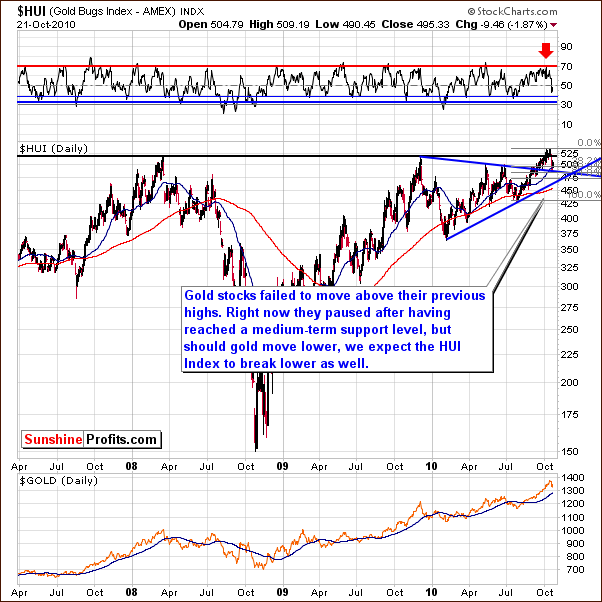
In this week's HUI (gold mining stocks index) Index chart, support levels have been reached. The 38.2% Fibonacci retracement level and the 50-week moving average are in play. The decline has paused at medium-term support levels and is currently close to a declining support line. If gold's price declines further and additionally stocks move lower, mining stock index levels will likely fall as well.
In a recent Market Alert sent to our Subscribers, we discussed the possibility for Traders to bet on lower prices using options. Lower prices in mining stocks may be the way to go due to their lower volatility. Their close trading range has caused a decline in option premiums.
In the research section of Sunshine Profits website, Predicting and Taking Advantage of Corrections in Gold is an essay, which is perfect for our current situation. Options traders should be sure not to miss this instructive piece.
Summing up, it is likely that mining stocks will eventually rally but we will probably first see a corrective period. Lower prices are likely to be seen in the short-run with a rally to follow perhaps before the end of the year.
To make sure that you are notified once the new features are implemented, and get immediate access to my free thoughts on the market, including information not available publicly, I urge you to sign up for my free e-mail list. Sign up today and you'll also get free, 7-day access to the Premium Sections on my website, including valuable tools and charts dedicated to serious PM Investors and Speculators. It's free and you may unsubscribe at any time.
Thank you for reading. Have a great weekend and profitable week!
P. Radomski
--
This week we are moving from Chilean miners to China and its unwillingness toward fast yuan appreciation. Instead Chinese officials preferred to raise the interest rates despite complaints coming from U.S. and Europe. This action served as a catalyst for the needed decline, and this is what we've seen since the past several days. In this week's report we are putting currency wars along with Big Mac Index and rare earth minerals in order to provide you with the big picture before moving on to the technical part.
The 23 charts that we've prepared for you today include 5 gold charts (what does gold's performance relative to corporate bonds tell us?), silver (also from the non-USD perspective), SPY ETF, Broker/Dealer Index, mining stocks (XAU, HUI, GDX), our correlation matrix, USD, Euro Indices and more.
Additionally, we speculate on the action that the investors holding junior mining stocks might need to take soon. We encourage you to Subscribe to the Premium Service today and read the full version of this week's analysis right away.
We encourage you to Subscribe to the Premium Service today and read the full version of this week's analysis right away.
Back