
This essay is based on the Premium Update posted November 13th, 2009. Visit our archives for more gold articles.
"Inside the Global Gold Frenzy" is the title of an article that appeared last week in The New York Times. It seems the mainstream media has finally caught on to what we've known for a long time - we are in the midst of an honest-to-goodness gold rush. The article pointed out some interesting facts.
Starting out in a part of Switzerland that is the place where about one-third of the world's gold is refined into bars and ingots, the reporter tells us that every day truckloads of gold jewelry arrive from all over the world to be melted down.
"Business is booming," he reports. Demand for bars weighing 100 ounces or less for individual investors is up 80 percent, according to a Geneva company that owns the Swiss gold refining company.
Europe and the United States are the new emerging markets for inflows of old gold jewelry and individual investor sales, whereas in the past, hoarding gold as an investment was much more popular in the Middle East and Asia.
Moving on to London, the reporter tells that Harrods, the 160-year-old London department store, last month began selling gold coins and gold bullion ranging from tiny 1-gram ingots to the hefty, 12.5-kilogram, 400-Troy-ounce bricks, the kind that are stocked in the Fort Knox vaults. The public's response has been "astounding," with bars being more popular than coins.
This is a good indication of just how slow the mainstream media can be. India's huge gold purchase did not catch us by surprise, if you read last week's Premium Update. Does all this "gold frenzy" suggest a bubble? It will at some point, but were far from it. Please remember that gold is only above it's 1980 high in nominal terms. Adjusting it for the inflation gives us price of gold much above $2,000, and that is by applying the official inflation statistics, which are generally not reliable in my view, as the way inflation is measured has been changing over years. In other words - It is likely that inflation is under reported.
There are few more things that I would like to cover before moving on to the technical part of this essay. I've been recently often asked about the correlation between the general stock market and PM stocks - can it ever be broken and what may cause this to take place, so I would like to take this opportunity to comment on that matter.
Generally, I expect the correlation with the general stock market and PMs to weaken significantly in the future (months, but how many remains unknown - 1 - 24). I expect investors to gradually wake up to the fact that PMs have MUCH more favorable fundamentals than the whole economy (thus the general stock market), and will not close their positions (yes, also hedge funds) as eagerly as they did before (during the 2008 plunge), should the main stock indices tank again. The question is, when will the people with the most cash on hand (biggest hedge funds dealing in PMs) start thinking this way. Gold above $1,000 is a big factor from this trade-o-psychological point of view. In the third - speculative-mania phase of the bull market in the precious metals, I expect "the rally to feed on itself" meaning that rising prices will attract even more buyers and so on - even without the significant influence from the dollar or the general stock market. In this way, the correlation with both of these markets would weaken.
Moving on to the technical side of the market, this free essay will precious metals stocks, it seems that this sector may provide us with a shorting opportunity, but only under specific circumstances.
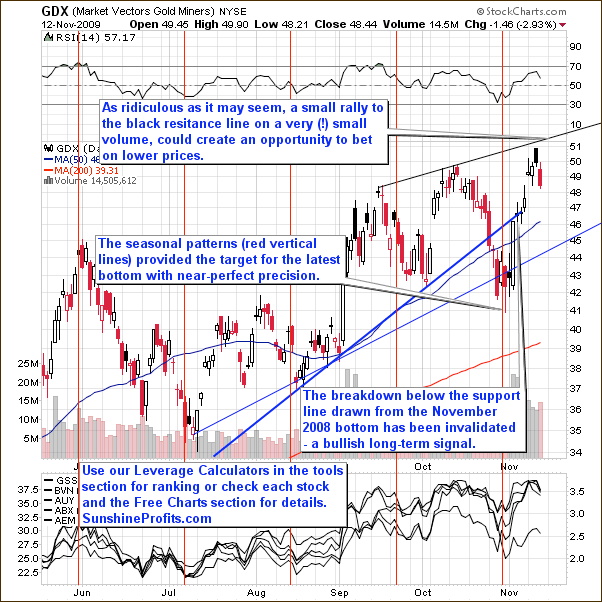
The value of the GDX ETF (proxy for the precious metals stocks) is very close the thin black resistance line, which makes probable that this rally will either take a breather at it, or correct. The analogous resistance line on the HUI Index has been touched this Wednesday, so there is a chance that the top has been put. Still, the "sell" signals are not coming from that many sources to make me send a sell alert - I will get back to this matter in the following part of this update. For now, the signals coming from the GDX ETF confirm points and signals made in the gold section. Should the PM stocks move to the black resistance line on a very high volume and we get additional bearish signals from other markets, I will consider betting on lower prices in the short term.
From the long-term point of view, it would be useful to take a look at the relative performance of the PM stocks to other equities into account.
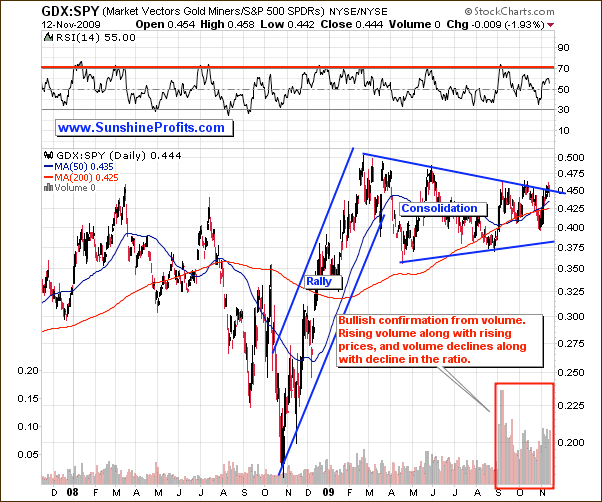
I have covered this ratio previously, when I wrote the following:
What we see above is a long consolidation after huge rally. This is really encouraging from the long-term point of view, as the rally that follows such a consolidation is often similar in size to the move that preceded it. If PM stocks manage to break out soon, we could see some real fireworks in the sector, for instance the GDX would equal the value of the SPY ETF. I realize that unless general stock market plunges, this means HUI above 800, but this is what the above chart suggests, and what I expect to take place sooner or later.
Today, the situation is similar, but currently the PM stocks are even more likely to break out of the 2009 consolidation pattern. Once they do break out, they may continue to rally strongly even despite weakness in the general stock market. This is not happening right now, but the ratio is trading very close to the resistance line, and since it is already it's fifth attempt to break it, it may finally succeed.
As I mentioned a few paragraphs earlier, the "sell signals" are not coming from many sources. One of them is the Gold Miners Bullish Percent Index (the relative amount of the gold stocks on the buy signal according to point and figure charts to all gold stocks taken into account).
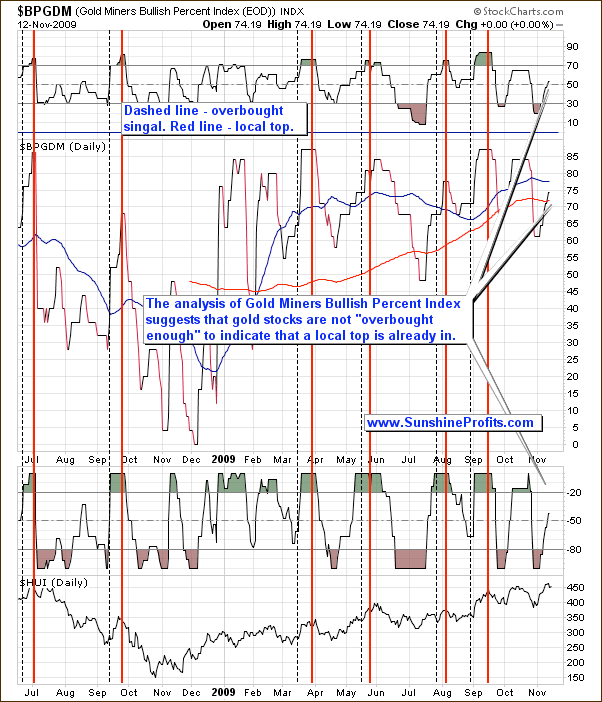
The high-probability sell signal is given if this index moves higher, and both indicators (RSI and William's %R) used on the above chart become, and then stay overvalued for some time. The initial overbought signal is marked with the vertical dashed black lines, and the top signal is marked with red lines. None of this was the case recently, so the probability that the top is in, becomes lower.
Of course the signal from this index is not "a must" for a top in the PM stocks to emerge - for instance the previous local top was not signalled in this way - this non-confirmation simply lowers the odds of an immediate downswing in the mining equities.
There is one more thing that I would like to cover this week before summarizing, and that is a signal generated by one of our unique indicators. The SP Gold Stock Bottom Indicator, which also suggests that PM stocks may peak, but most likely after an additional small rally.
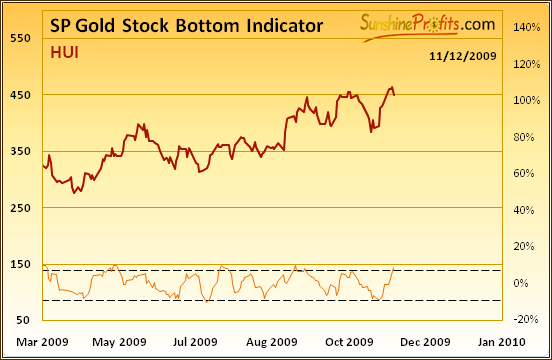
Please take a moment to study HUI's performance after this indicator moved above it's upper dashed line. Each time it happened, it meant that a top is near, but it makes sense to bet on higher prices in the immediate-term. This is another non-confirmation of the bearish signals from the GDX ETF chart analysis that makes me wait for additional signals before sending an alert with a "sell PM stocks" message.
Summing up, the short-term situation is rather mixed in case of the precious metals. There are early signs that the top is very close, so you may want to take some money off the table if you prefer to exit your positions rather early. On the other hand, the topping signals from the gold and GDX charts are not being confirmed by other methods of analysis, so if you prefer to stay in the market until it is very likely that this action is unprofitable, then I would currently suggest to hold your positions. I will keep you updated.
To make sure that you are notified once the new features (like the newly introduced Free Charts section) are implemented, and get immediate access to my free thoughts on the market, including information not available publicly, I urge you to sign up for my free e-mail list. Sign up today and you'll also get free, 7-day access to the Premium Sections on my website, including valuable tools and charts dedicated to serious PM Investors and Speculators. It's free and you may unsubscribe at any time.
Thank you for reading. Have a great and profitable week!
P. Radomski
--
This week's Premium Update is the biggest one that I've created so far and it includes the long-term silver chart and its detailed analysis, with the implications reaching much beyond the silver market itself. Additionally, I comment on the Nov 23rd options expiration, the change in the long-term silver cycles, and the likelihood/timing of a disconnection between PM stocks and the general stock market. Be sure to check it out.
