
This essay is based on the Premium Update posted August 29th, 2009. Visit our archives for more silver articles.
I have to confess to a love affair that goes back a long ways with that exciting, hyper-volatile metal - silver.
This week The Wall Street Journal reported that silver has enjoyed greater price gains than gold so far in 2009. The Journal noted that silver often follows gold, although sometimes with greater moves since it is a less-active market and thus more prone to volatile price swings. Naturally, silver's stillness is limited to many consolidation periods, and to the early parts of a particular upleg. When silver finally does move near the end of a rally, the move is likely to be substantial. So far in 2009, December silver futures have risen 26%, while December gold is up 6%, the Journal reported.
Knowing about the relationship between silver and gold can mean large profits at the right time, so I would like to revisit this topic.
Silver, sometimes referred to as "poor man's gold," is often bought alongside gold as a hedge against dollar weakness, inflation fears and geopolitical turbulence. But silver also has a more significant role as an industrial metal because of its application in batteries, cell phones, computers, TV's, refrigerators, medical applications, satellites, weapons systems, electrical wiring applications, etc. In the majority of cases this silver is never recovered. Once it's used up, it's used up.
As mentioned earlier, the rule of thumb is that generally silver initially lags behind gold, but as gold gathers steam, speculators flock to silver and ignite the sharp moves higher for which this fidgety metal is so famous. We can also expect silver to drop faster than gold during a recession. We saw that in the recent stock panic when gold was fairly resilient while silver nose-dived. The yellow metal hit a 14-month low at its worst, while silver spiraled down to a 34-month low.
Today there is a confluence of factors on the demand side for silver: Investment demand, industrial demand and the fear factor due to the economic situation which has not yet resolved itself. We also need to keep in mind that we have another factor, one I touched on last week-- almost 2 billion new consumers in China and India who are moving into middle class status and are acquiring a taste for gadgets. Gadgets require silver. In other words, there is a growing demand for silver as an industrial metal and as an investment vehicle while the supply continues to dwindle.
Looking back at history we learn the lesson that we can expect silver to drop faster than gold during a recession, and silver to rise faster than gold during a bull market in the metals.
A simple application of this observation is to trade silver for gold in the middle of a recession, when a bull market in gold and silver is about to start, and to trade gold for silver at the top of a bull market in precious metals.
Today's ratio of gold to silver is 64.6 ounces of silver equal the value of one ounce of gold. With gold today at $956, and a normal, historical 12 silver to gold ratio, (referring to its occurrence in nature, and ratio's value through centuries) silver should be trading near $80.This is about 400% higher than it was trading for this week. So, if the price of silver gravitates to its historic ratio, we can bank on some nice profits. It's impossible to tell the exact date when this would take place, but I expect the ratio to go much below its historical average of 12, most likely in a few years.
Since we're already on the subject let's begin with analysis of the silver chart (charts courtesy of http://stockcharts.com).
Silver

As far as timing the silver market is concerned, the similarity is still intact between the two time frames that I mentioned in the previous Premium Update. The situation developed as I expected and we saw higher silver values this week. Not only did silver manage to stay above the long-term support lines, but it was also able to once again move above the short-term one. Moreover, this move (which took place on Friday, August 28th) materialized on high volume (as marked with the blue arrow on the chart above), which serves as a confirmation of the bullish signal.
The bottom in silver was accompanied by a buy signal from the Stochastic Indicator, which was also the case at the end of January 2009. Back then a relatively large rally followed, so this may also be the case here. Naturally, we may need to wait for additional few days of prices closing above the 14.5 level in order to confirm the move, but given the size of the volume on Friday, I think it is likely that we will move higher from here.
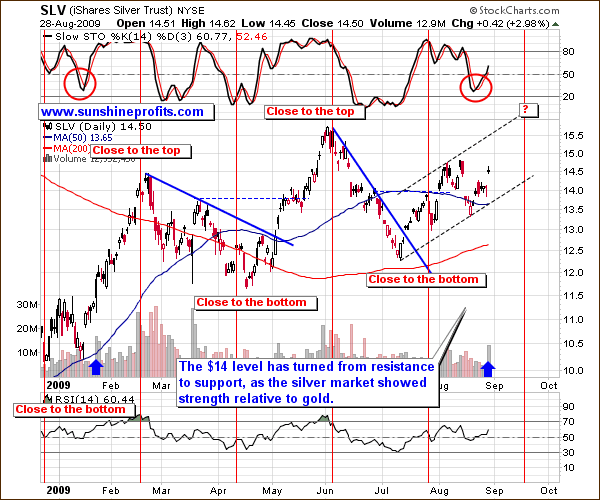
The analysis of the medium-term chart emphasizes the size of the volume of Friday's session. Combining this bullish signal with the cycle analysis that I've featured suggests that higher prices are to be expected from here - with a local top several weeks away.
General Stock Market
For a considerable amount of time the main stock indices have been rising on a declining volume. Such a divergence usually suggests that the rise is only temporary and that the true price direction is down. Whereas this could be the case here, I would like to point your attention to the fact that the level of volume we are seeing is not yet screaming "sell".
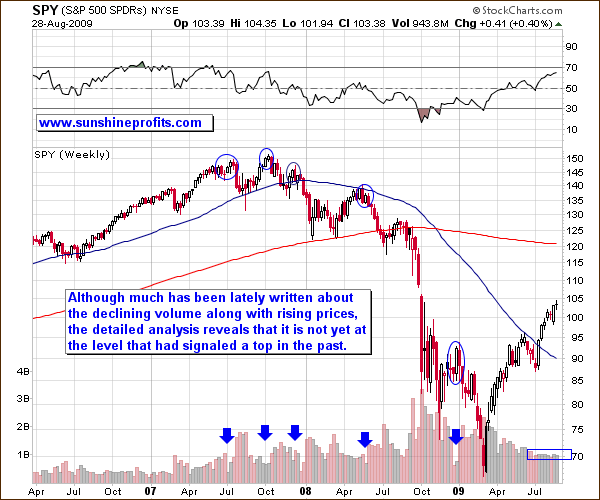
Since it is the long-term tendency that is the subject of this analysis, I have used the weekly chart that filters out the daily noise. The weekly SPY ETF chart makes it easy to compare the volume that accompanied previous tops to the volume in the previous weeks.
Please note that past tops were mostly accompanied by volume that was visibly lower than what we have seen in the past several weeks, so we may indeed move even higher (The next Fibonacci resistance level is just below 110, which is also close to the upper border of the price gap - 108.02, which formed in early October 2008) before correcting.
Summary
This week the precious metals sector moved higher; silver rallied on strong volume, which may mark a beginning of a new substantial upleg. Gold is currently in a cloudy technical situation, and much depends on what happens in other markets.
The value of the main stock indices is naturally an important factor as well, especially for PM stocks and silver, due to its many industrial uses. For now the general stock market is overbought, and it moves higher on a declining volume, but the size of the volume is not yet very low, so it would not surprise me to see even more strength in DJIA and S&P 500 before they make a move lower. It's too early to say whether such a move would drag PMs down along with them. Additional signals come from our indicators and from the analysis of other markets, but I will leave that part of the commentary to my Subscribers.
To make sure that you get immediate access to my thoughts on the market, including information not available publicly, I urge you to sign up for my free e-mail list. Sign up today and you'll also get free, 7-day access to the Premium Sections on my website, including valuable tools and charts dedicated to serious PM Investors and Speculators. It's free and you may unsubscribe at any time.
P. Radomski
--
Last week Premium Update readers got an early "heads up" about rising prices in silver and PM stocks. If you entered trades, you made money. This week we explore aspects of the relationship between silver and gold trolling for profit opportunities, since silver may be starting a new upleg. The general stock market has been referred to as overbought, but does that really mean that a top is imminent soon?
