
This essay is based on the Premium Update posted November 10th, 2009. Visit our archives for more gold articles.
Gold fell almost 5% last Friday to below $1,160 an ounce on the latest "positive" jobs data. Tuesday, gold futures fell for a third straight session as worries about credit problems in Greece and Dubai helped the U.S. dollar extend gains. This clearly is the beginning of the gold correction that I have been predicting for weeks (Market Alerts about exiting positions were sent on Nov 27th and Nov 30th).
Is there any reason to be worried about the long-term bullish trend for gold?
If you are not a regular reader of the China Youth Daily (in Chinese), it's possible that you may have missed one of the November reports.
The paper reported a high-ranking government official saying that China should increase the amount of gold it holds in reserves to reduce potential losses from a depreciating dollar.
"We recommend China increase its gold reserves to 6,000 metric tons within three-to-five years and possibly to 10,000 tons in eight to 10 years," said the paper, citing Ji Xiaonan, chairman of the supervisory committee overseeing large state-owned enterprises under the State Council.
In previous Premium Updates I mentioned that China is undergoing major changes in the way it handles gold. Private gold ownership had been outlawed in China for generations until 2002, which is when the Shanghai Gold Exchange opened and began free trade in gold for the first time in the nation's history. Even more recently, China legalized gold investment by private citizens and even advertises its benefits in television infomercials. The Chinese government is telling its citizens that gold and silver are good investments that will safeguard their wealth. People in China are lining up outside of banks, post offices, and the new official mint stores to buy gold and silver.
Considering the high savings rate in China (mostly in the 30% - 40% area in the previous years), gold is a logical investment for the Chinese and it's possible that billions of dollars in Chinese private investment could move into gold in coming years. Already there is talk of China overtaking India as the world's largest consumer of gold.
Consequently, the fundamental situation remains positive, which means that the bull market is still far from the ultimate top, but it doesn't have the decisive impact on the short-term price swings. In this case, to avoid brutal sell-offs (like the one that we are currently experiencing) one needs to carefully analyze the current situation i.a. by applying the technical analysis. Let's begin with the long-term gold chart (charts courtesy of http://stockcharts.com.)
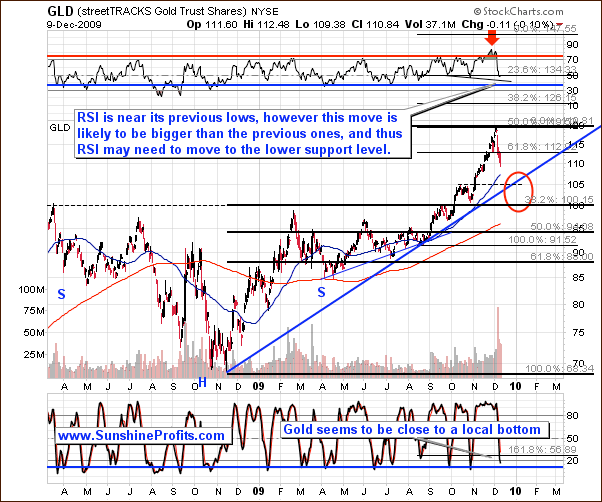
First thing that comes to mind after taking a look on the above chart is the size of the volume that accompanied the very recent sell-off. It is created by large amount of orders (mostly stop-loss orders) that are being filled when fear takes over greed after a substantial rally. Generally, the more rapid, and parabolic upswing is, the more brutal the following correction. This goes double for the precious metal market, on which corrections tend to be sharp in almost all cases.
The above chart provides two targets for this downswing. The first one is visible directly on the chart (red ellipse), and the second one that we can infer from the indicators. I realize that the red ellipse is relatively large, and does not provide one single price/time target, but we will have more details once we move lower and I'll be able to examine the shape of the downswing. $105 in the GLD ETF seems to be capable of stopping this decline, as there are two support levels at this particular point, but even if gold is to test $1,000 once again, it would not invalidate the bullish implication of the chart.
The second target comes from the analysis of indicators. Stochastic and RSI indicators are not low enough to indicate that a major bottom is in (thick blue vertical lines), but they are at the levels that corresponded to local bottoms in the past so we might expect a small pullback from here.
Let's turn to PM stocks to see if we get a confirmation of these points.
Precious Metals Stocks
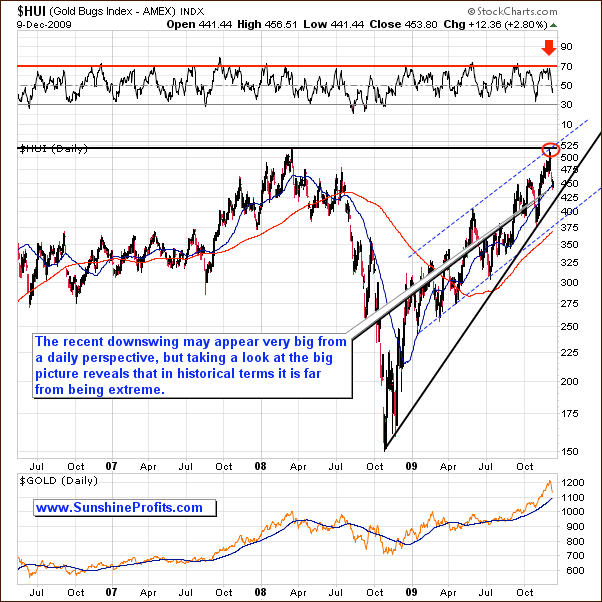
The long-term HUI chart reveals that the current correction is not that big, as one might expect it to be based on monitoring daily moves during this week. The value of the index has declined after it reached a very strong resistance level (as I suggested in the past updates), but it is still relatively far from a major support level.
This means that although HUI may appear oversold on a short-term basis, it doesn't seem that the bottom has been put just yet. After all, the history tends to repeat itself or at least it rhymes, and the previous corrections have been bigger than what we've seen so far - especially that the move preceding the top had been substantial.
Summing up, precious metals have been correcting this week and it seems that we are in the early part of the decline, which unfortunately means that much is still unclear about the way the situation is going to develop from here. Many clues suggest that this decline is about 50% over, but I will not be able to make detailed extrapolations of the first part of the decline, until we are certain that it has been indeed completed. However, the fact is that we are not at the top, so if you are risk averse (and the risk in PMs is to be out of the market) and long-term oriented then you may not want to wait too long before re-purchasing your PM investments.
The current decline did not catch my Subscribers by surprise - in the Nov 27th Market Alert I wrote that staying out of the market for the next several days/weeks (speculative capital) seems justified, and I've repeated it in the Nov 30th Market Alert when I wrote that the top is likely to be reached regardless of the Dubai debt problems (Consequently, I believe it is justified to exit one's speculative positions in the precious metals market). Several days later PM prices plunged. Since Nov 27th, GLD moved from 115 to 110 and GDX declined from 51 to 48, which means that you would have saved about 4.5% in GLD and 6% in GDX so far, if you exited your positions in these ETFS on the Nov 27th. Consequently, if the capital that you trade (gold and PM stocks) amounts to at least $12,000, then the savings are already bigger than the yearly cost of the Premium Service. Naturally, if one waited a day or two, these amounts are even bigger.
To make sure that you are notified once the new features (like the newly introduced Free Charts section) are implemented, and get immediate access to my free thoughts on the market, including information not available publicly, I urge you to sign up for my free e-mail list. Sign up today and you'll also get free, 7-day access to the Premium Sections on my website, including valuable tools and charts dedicated to serious PM Investors and Speculators. It's free and you may unsubscribe at any time.
Thank you for reading. Have a great weekend and a profitable week!
P. Radomski
--
In this week's Premium Update, I cover the long-, and short-term charts for gold, silver, PM stocks, USD Index, and main stock indices. Moreover, I analyze the price of Apple, Inc. (yes, in a way it is related to the precious metals market). Additionally, I feature and comment on the very recent signals from two of our indicators and explain how one can read them.
