
This essay is based on the Premium Update posted on October 1st, 2010. Visit our archives for more gold & silver articles.
We continuously ask friends to send links to stories on gold they encounter in their daily excursions on the Internet. These are people who do not follow the financial markets. We want to get an indication of how many gold stories ordinary folks are bumping into. We were away for a week and upon returning we had almost 200 e-mails in the inbox among them many links to gold stories sent by our diligent friends. Even before zealously tackling the charts and tools, this made us think that the recent run up is not the start of a big runaway rally that would take us to $1,500. A correction is needed first. If friends are seeing so many gold stories, so is everyone else. It is the golden bull's primary and malicious objective to shake off as many investors as possible trampling them in the process. (This is why we urge our Subscribers to hold on to long-term positions and enjoy the ride - only a powerful combination of multiple strong bearish signals would make us consider selling our long-term positions.)
Gold is particularly attractive since the Fed has cut interest rates essentially to zero. Gold is more attractive than money in the bank. You don't earn interest on either gold or cash, so by holding gold today you're not giving up interest. But you also don't give up the potential of gold's bull run. The Fed can keep printing cash. It can't print gold.
It seems that gold will need to consolidate before going higher. Once the correction is done, it's not out of question that the price of gold will reach $1,500. I seriously doubt that the recent run up is the final stage of the bull market. In fact, it seems that there are several more good years. We're looking forward to it, especially in silver.
We look at the long-term chart for silver chart (charts courtesy by http://stockcharts.com) to answer the question "How high will the rally in silver go before consolidating?" We compare previous breakouts in order to measure and estimate probable target levels for the near-term.
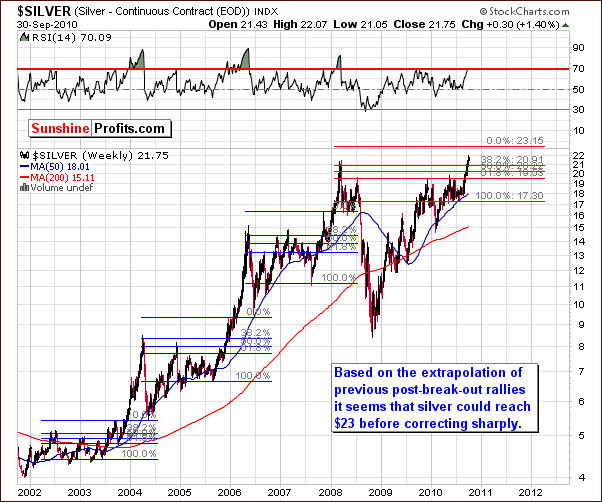
Bull markets often can be studied using self-similar pattern ideology. In other words, patterns seen previously on a smaller scale can apply to the present on a larger scale. This is also why we use a logarithmic scale to present prices, since a previous $2 rally when silver was at $4, (a 50% move) may today be only a 10% move when silver is above $20.
An important observation is that local tops have been followed by sharp declines and then huge rallies. We have seen this pattern repeatedly. Very-short-term traders may wish to take advantage of these trends. If moves are to be made in these volatile times, we highly recommend using trailing stops. We will not try to time this move with our own capital, as we are not very-short-term oriented. Still, the full version of this essay includes timing details on the short-term chart.
The new target level for gold has been set around $1,500. Please take a look at the long-term gold chart below.
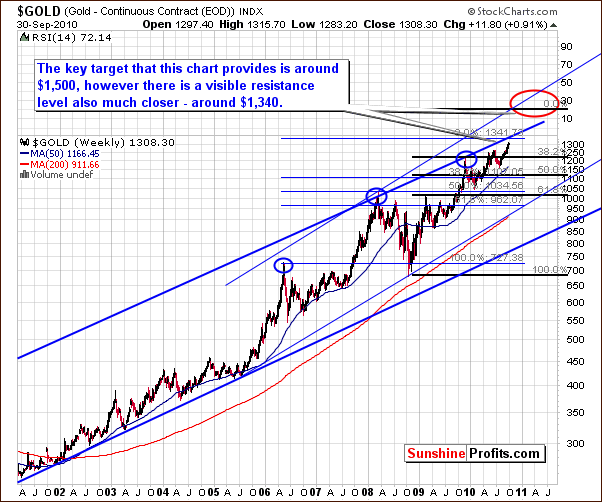
We obtain the $1,500 target by applying the 1.618 Phi number to previous local tops, specifically those seen in June of 2008 and June of 2010. This also coincides with the upper/steeper blue line in the above chart. Since it appears that we are indeed in the second stage of the bull market for gold, which began in 2008, the steeper rising trend channel seems the better choice for the long-term analysis at this time.
Before the lower, less steep line is surpassed, it is likely that gold will first reach a local top and then go through a quick consolidation. This will most likely result in a greater strength and increase the odds of a further rally being sustained. Subscribers to our Premium Service get the specific number projected for this local top. We base the number by extrapolating the span between the highs seen in 2006 and 2008. That is to say, if the percentage increase of 2008 over 2006 is repeated in this year as compared to 2008, then we get the specific number for the next local top.
Our readers may notice that we often use Phi number to analyze tops and bottoms, including the annotations on the above charts. This is not something random we have pulled out of a hat. The Phi number is also known as golden number, divine proportion, Latin sectio aurea and so on (read more about Phi here). This number is known for its wide use in art, mathematics, observation of nature and - of course - market analysis. Vladimir Lefebvre once demonstrated that humans exhibit positive and negative evaluations of the opinions they hold in a ratio that approaches Phi, with 61.8% positive and 38.2% negative. Assuming that changes in markets reflect human opinions, we can use Phi number in our analysis. Naturally, this goes much deeper than the quick sketch we just presented. The most important reason for applying the Phi number into market analysis is simply because it often works.
Summing up, gold is likely to reach a local top very soon and then consolidate. It is likely that it will then rally further, perhaps to $1,500. Several retracement level factors yield the same conclusions when applied to previous highs and lows seen during the past four years. We see further validation when studying gold from the perspective of other world currencies, including the Japanese yen.
To make sure that you are notified once the new features are implemented, and get immediate access to my free thoughts on the market, including information not available publicly, I urge you to sign up for my free e-mail list. Sign up today and you'll also get free, 7-day access to the Premium Sections on my website, including valuable tools and charts dedicated to serious PM Investors and Speculators. It's free and you may unsubscribe at any time.
Thank you for reading. Have a great weekend and profitable week!
P. Radomski
--
Among other issues this week we comment on major players like Calyon Credit Agricole and Deutsche Bank, as they both raised bar for their outlook on gold. We also speak about inflation, which PIMCO sees as very likely in next 10 years and about something that looks like international currency war with dollar, renminbi and yen as major forces.
In somewhat shorter perspective we see gold, silver and mining stocks moving higher, however, many points from this week's analysis suggest consolidation. Is it going to happen or will precious metals ignite another powerful upleg without a minute pause? With Correlation Matrix we can trace latest swing in important correlation between gold and USD Index, which in turn provides details regarding the reply to the above question. The analysis of gold priced in Japanese yen (being to some extent different from other non-USD currencies), further validates our assumptions.
Additionally, this week's Premium Update includes our analysis of two of our unique indicators (one of them flashed a signal yesterday) including the SP Long-Term Junior Indicator dedicated exclusively to the junior sector. Speaking of juniors, this week's Premium Update includes our up-to-date rankings of top gold and silver juniors.
We encourage you to Subscribe to the Premium Service today and read the full version of this week's analysis right away.
