

Aiming to make money on gold price’s decline is always controversial. The long-term fundamentals remain favorable and gold and silver are likely to exceed their previous highs in the coming years. True, but that doesn’t mean that both metals can’t move even lower in the next several weeks or even months. Different factors govern more short-term-oriented trades as markets are emotional, not logical in the near term.
One of the popular techniques that is used to detect good entry and exit prices for gold is the RSI indicator and the most popular way to use it is to buy when RSI moves to 30 and sell when RSI reaches 70.
Yet, sometimes it’s a good idea to keep shorting gold even with RSI close to 30. In today’s articles we’ll explain why this is the case.
Some may definitely say that it is dangerous or even stupid. But, is this really the case? If one wants to make money in the market, one needs to go beyond the regular rules of thumb and dig deep into a given market and verify how it is really affected by certain signals. Plus, one needs to be sure that they are applying the tools where they should be used. For instance, forks are very useful for many things. But, not for eating soup, writing an essay, or chopping wood.
The RSI is an excellent tool for detecting tops and bottoms in gold during a horizontal (sideways) trend and it’s also quite useful during a steady rally. This has been confirmed by multiple cases in the past.
But, this is not the case during the medium-term downtrends, especially the more volatile ones. Let’s take a look at gold’s medium-term chart, focusing on the previous huge downswing (late 2016).
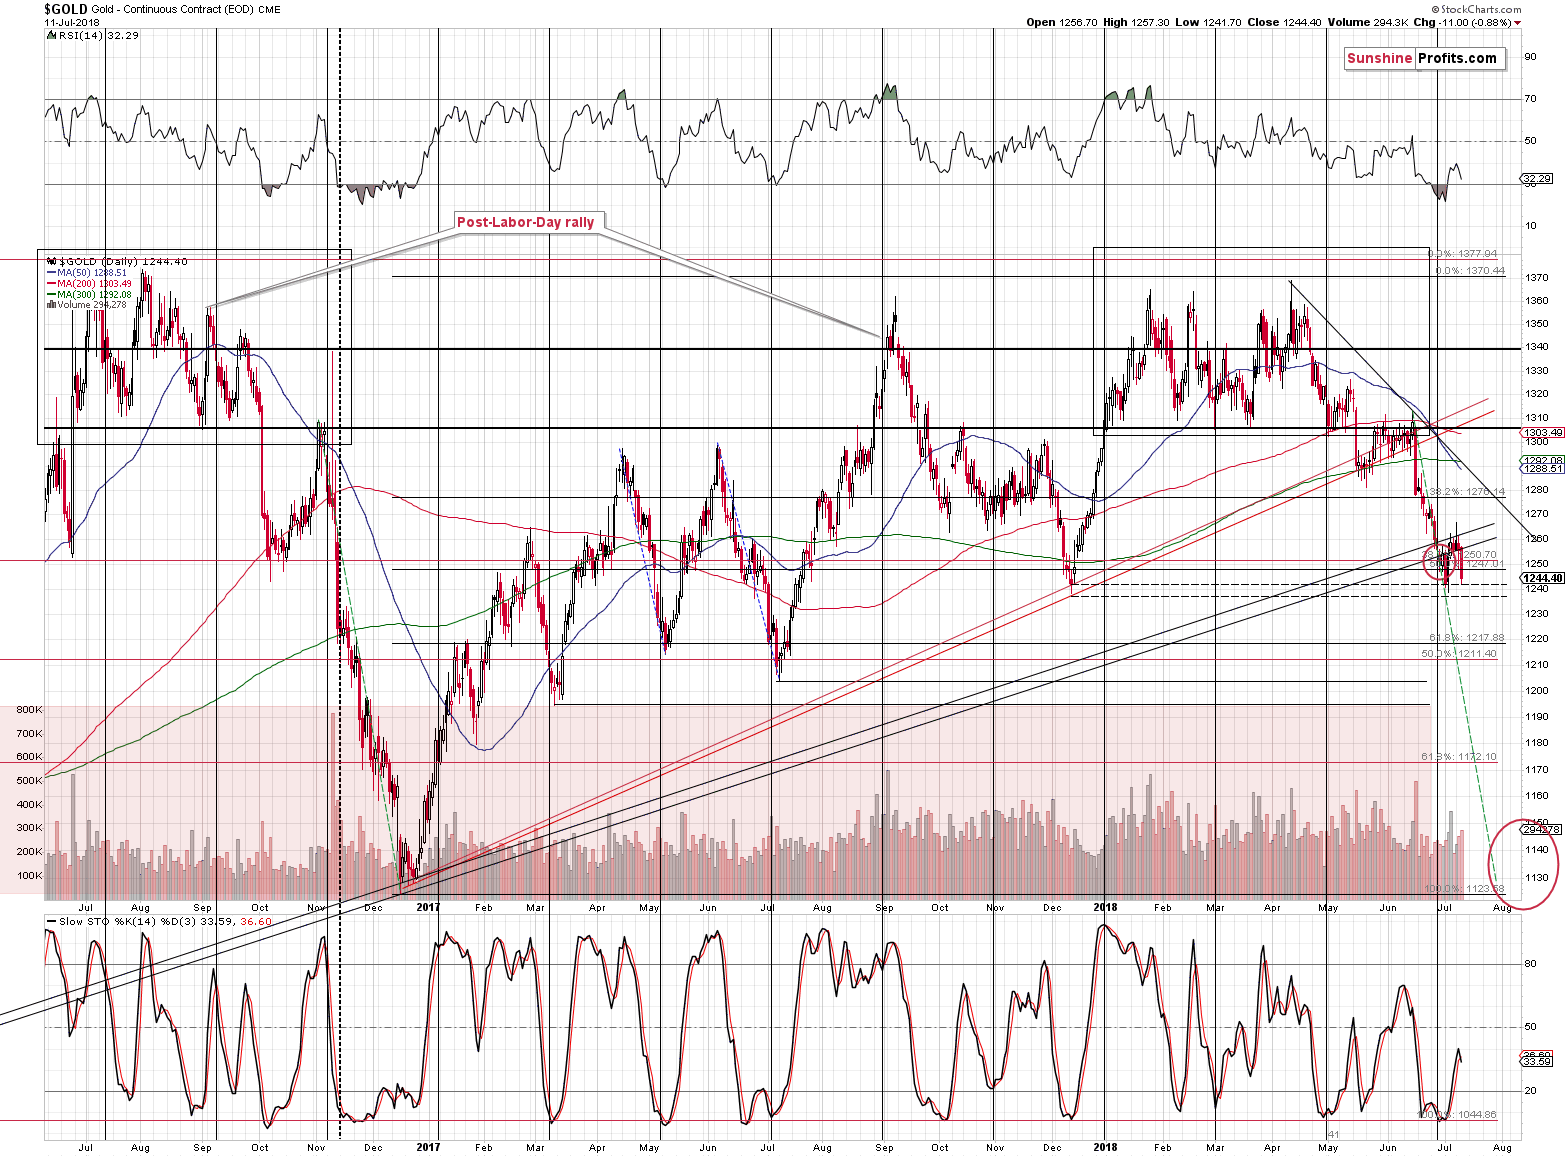
The biggest part of the downswing took place in November 2016 and in the early part of December. Why is this significant?
The RSI moved below 30 based on the November 11, 2016 session, which is when gold closed at $1,224. Even though it was after a decline, it was a great shorting opportunity. Gold bottomed about a month later at $1,130 – almost $100 lower.
One may say that this was just a one-time development and that it’s just a single exception that doesn’t change the rule. But that’s simply not the case. There was just one huge decline, so it’s no wonder that there was only one case when gold moved lower after the RSI moved below 30.
But there were other major declines that we can discuss. Due to many similarities, it seems that the comparison to the 2012-2013 decline will be most useful.
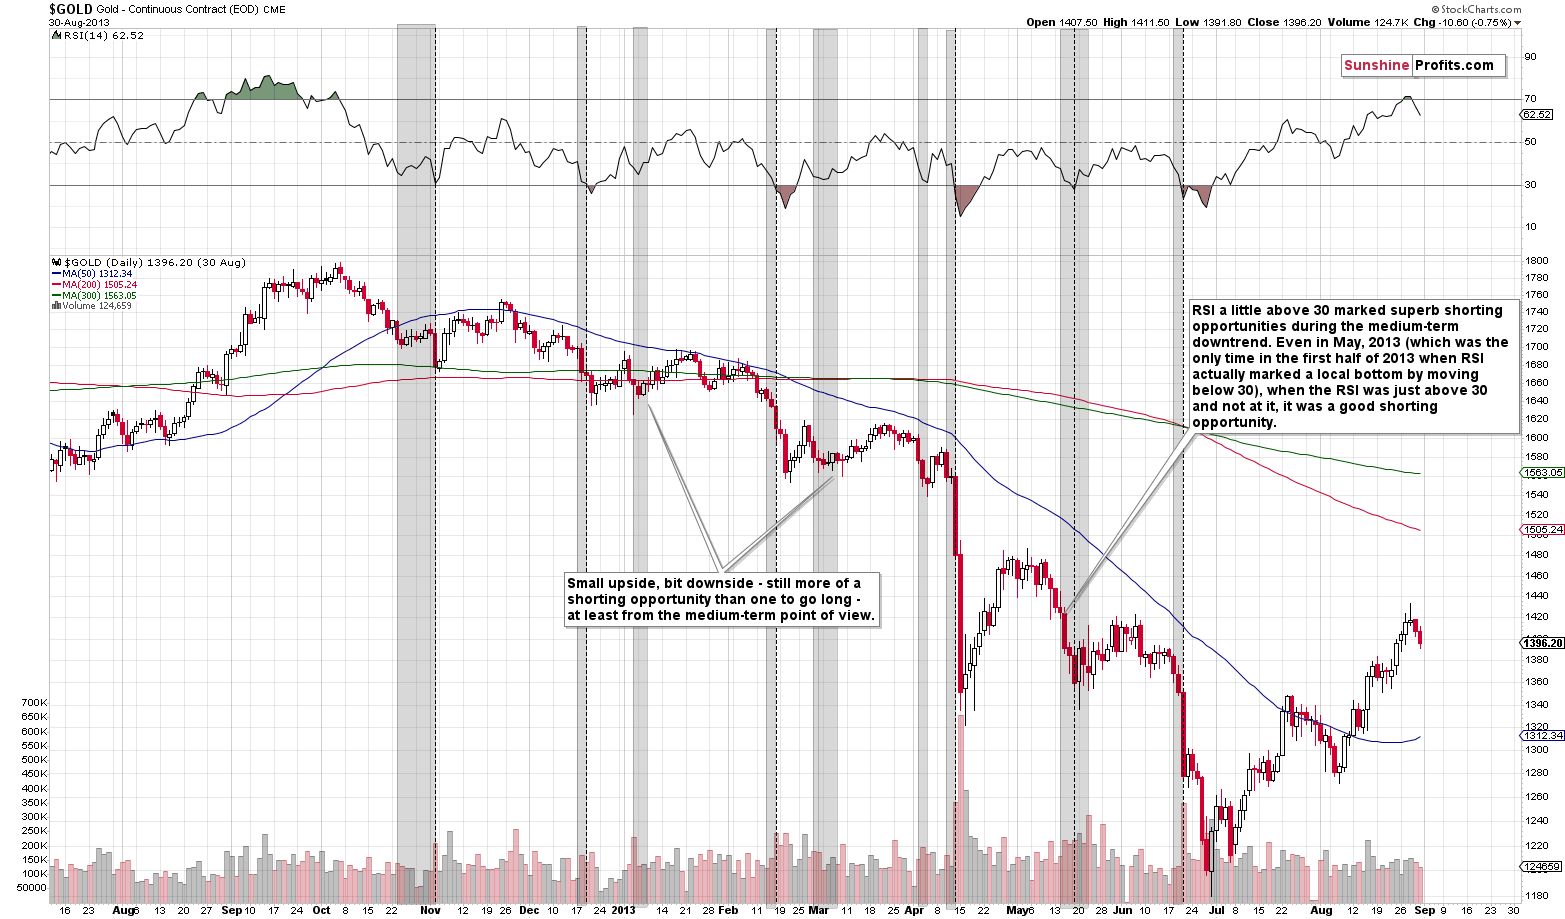
The vertical dashed lines represent times when the RSI broke below the 30 level and the gray areas mark the times when the RSI was close to 30. What kind of action in gold did we see on those occasions?
In the first case, at the beginning of November 2012 (when gold was still trading sideways rather than declining), the RSI’s move to 30 marked a local bottom.
In mid-December 2012, an analogous signal was seen right before the bottom - not at it. Gold’s post-bottom rally took the yellow metal only a bit higher than gold had been trading when the RSI moved below 30, so it was hardly a buying opportunity. Considering what took place in the following months, it was much more of a shorting opportunity.
In mid-February, the RSI’s move below 30 was immediately followed by lower prices and after a nearby bottom, gold only moved to the price level that we saw when the signal had been seen. This makes it a great shorting opportunity, also in light of what followed in the months to come.
In mid-April the RSI moved below 30 after the first day of the decline and right before the biggest daily (over $100) decline that we have on the above chart. That was an excellent shorting opportunity, not a time to buy.
In mid-May, the RSI marked a local bottom, but it was followed by a relatively small rally and a relatively big decline. Was this a buying opportunity or a shorting one? From the short-term point of view, it was a buying one, but being realistic, it might have been difficult to exit at the local top that followed and waiting things out would have resulted in missing the profits from the entire big downswing, not to mention losses that holding onto a long position would have caused.
In mid-June we saw something similar – gold moved only a bit higher after the RSI’s move below 30 only to decline shortly thereafter. From the signal to the intraday bottom – gold declined about $100. Again, a great shorting opportunity.
Summing up, almost all classic buy signals from the RSI seen during a medium-term downswing were good shorting opportunities.
But, let’s consider the times when the RSI was just close to 30, like what we have right now – the areas marked in gray.
The late-October 2012 area preceded the early November bottom and we then saw a move higher, but not a significant one. It’s a tough call to say if that was a good buying or shorting opportunity – it depends on one’s approach too much.
The mid-December area was clearly preceding a bottom and it was a good shorting opportunity.
The January 2013 area was followed by a rally that was rather limited, but overall, one could say that the implications were bullish.
The mid-February 2013 area was a clear shorting opportunity.
The early March 2013 area was followed by a small rally that ultimately was followed by a huge slide. It was somewhat bullish for the short term, though.
The early April area was a good shorting opportunity in the very short term and in terms of the next few weeks.
The mid-April area was the best shorting opportunity of the year, and perhaps a decade.
The mid-May area was a good shorting opportunity as well.
Finally, the mid-June area was once again a great shorting opportunity.
Summing up, once again, during the medium-term downtrend, the RSI close to 30 marked great shorting opportunities much more often than it marked buying opportunities. Moreover, the buying opportunities that it did mark were rather weak, and the shorting opportunities that it marked were profound and very profitable.
Additionally, two biggest downswings (April and June 2013) included a “buy” signal from the daily RSI close to the middle of the move. In the first case it was followed bya slide of about $140 and in the second case by about a $100 one.
If we take into account the times when the RSI was a bit above 30, but not at it, then we can see that both extreme declines in gold were followed by this kind of “buy signal”. The same goes for many smaller (but still significant) declines, like the February 2013 one.
It’s also true to say that in 2013 there was no huge decline in gold without the RSI close to 30 before. Consequently, with gold in a medium-term downtrend, refusing to open short positions based on the RSI being close to 30 seems to be a very effective way to miss out on all big slides.
What does it mean in plain terms? It means that if gold is in a strong medium-term downswing, expecting the RSI based on daily prices to indicate a bottom in a classic way is like trying to chop a tree using a fork.
Consequently, the final implications come down to the question if gold is in a medium-term downtrend. The reply is quite straightforward - of course it is due to multiple bearish signals that we discussed previously and the recent breakdown below the rising medium-term support line and its verification serve as a strong confirmation.
 Details available to Subscribers only.
Click here to subscribe.
Please note that the above is based on the data that was available when this essay was published, and we might change our views on the market in the following weeks. If you’d like to stay updated on our thoughts on the precious metals market please join our subscribers today..
Thank you.
Sincerely,
Przemyslaw Radomski, CFA
Founder, Editor-in-chief, Gold & Silver Fund Manager
Gold & Silver Trading Alerts
Forex Trading Alerts
Oil Investment Updates
Oil Trading Alerts
