
This essay is based on the Premium Update posted on July 30th, 2010.Visit our archives for more gold articles.
In the last two essays we have emphasized the influence that the dollar and main stock indices might have on the precious metals and we have summarized our last essay by stating that we are likely to see a short-term bounce to the upside (...) perhaps very soon. Since this is what happened we would like to let you know where - in our opinion - gold is likely to go next.
However before providing you with gold charts, please take a moment to study the following euro charts, as it will provide you with useful background information. Let's begin this week's technical part with long-term Euro Index chart (charts courtesy by http://stockcharts.com.)
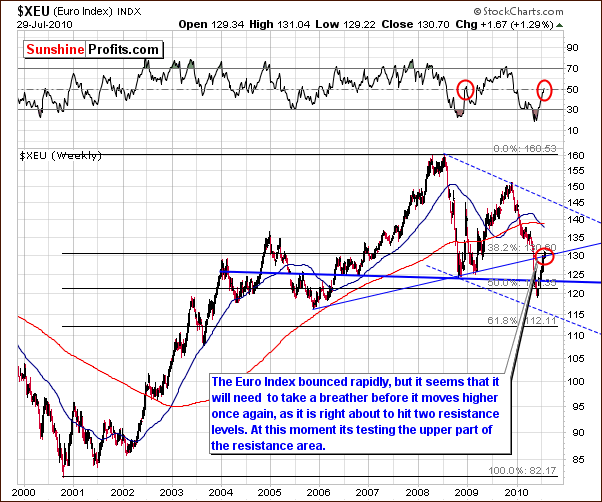
Once again, this week's long-term Euro Index chart shows that there has been little change from last week. However, we have seen a struggle for movement above the resistance line created by the lows of 2005 and 2008. This also closely corresponds to the 38.2% Fibonacci retracement level (of the massive 2000 - 2008 rally) and we presently see the upper border of the resistance area being tested.
During a similar period in the past - at the end of 2008, the RSI move to 50 before the euro showed any serious decline. It then moved below 40 for some time as euro tested its previous bottom. This is quite similar to what we have seen recently. The RSI actually dipped into the 20's and has now rebounded to near 50. Although the euro doesn't need to go as low as its previous low (meaning 120 on the above chart) - and we would not recommend basing such forecast based on the RSI alone - there is a possibility that we are very near a local top today with a brief correction likely to be seen in the short-term.
Close inspection of the long-term chart shows how the 38.2% Fibonacci retracement level corresponds to today's index level. This is an important point since the retracement level itself is based upon a noteworthy downswing. Let's take a look at the short-term chart below for more details.
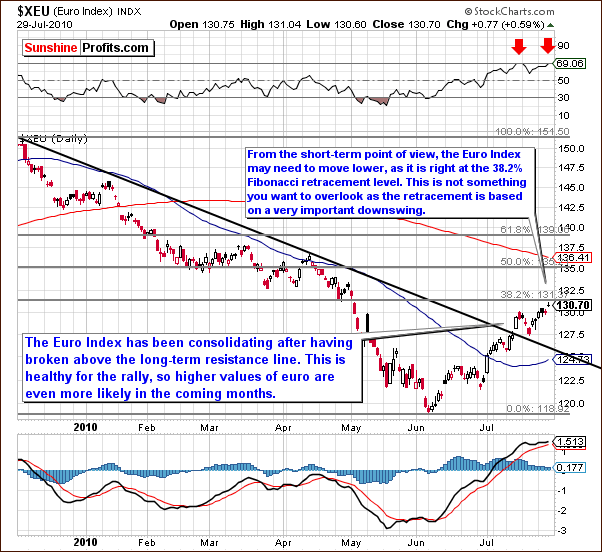
The short-term Euro Index chart confirms a movement above the Fibonacci retracement level created by the 2000-2008 Euro Index rally. This is also true for the retracement level created from the decline seen between December, 2009 and June, 2010. So, in fact we have two Fibonacci retracement levels that intersect at the same level, thus making the resistance here even stronger.
The RSI based on the daily prices is presently near 69 which corresponds to the recent local top seen in mid-July. At this time, we remain bullish for the euro over the next several months or so. A slight move lower may be seen in the short-term which will likely be coupled with a corresponding move higher in the USD Index. The currency exchange rate accounts for more than 50% of the USD Index and for this reason the Euro and USD Indices remain tightly tied in how they react to one another. The implications for gold, silver and mining stocks are positive in the short run as well, which confirms bullish points made above and also in our July 27 Market Alert, in which we've suggested closing short and opening long positions in precious metals.
For more details, let's take a look at the below chart.
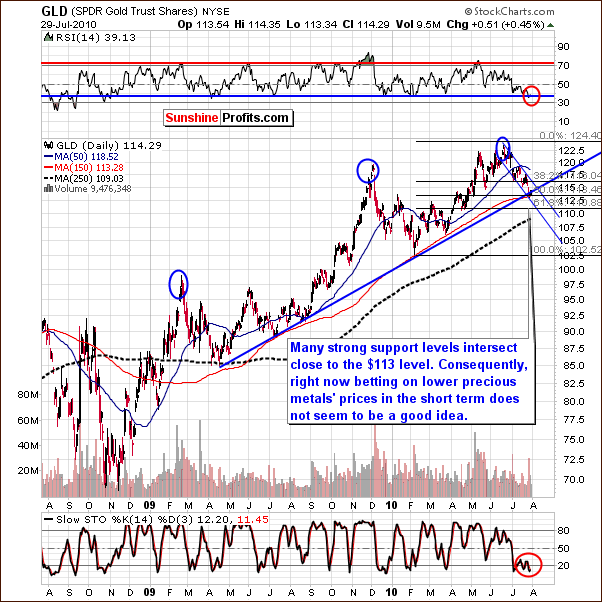
As indicated in that particular alert many strong support levels intersect near the $113 level: the 150-day moving average, the 50% Fibonacci retracement level based on the February to June rally, the lower border of the trading channel, and strong support as indicated by high volume levels.
When gold prices decline after a prolonged downward trend and very high volume is seen, this frequently indicates the final day of declining prices. This week's chart indicates the possibility that this may well be the situation at present.
The targets, which we projected in prior updates, are being reached now. The first target, circled in red in the chart corresponds to the $113 level. A bottom appears to be in, and the contra-trend rally now seems likely.
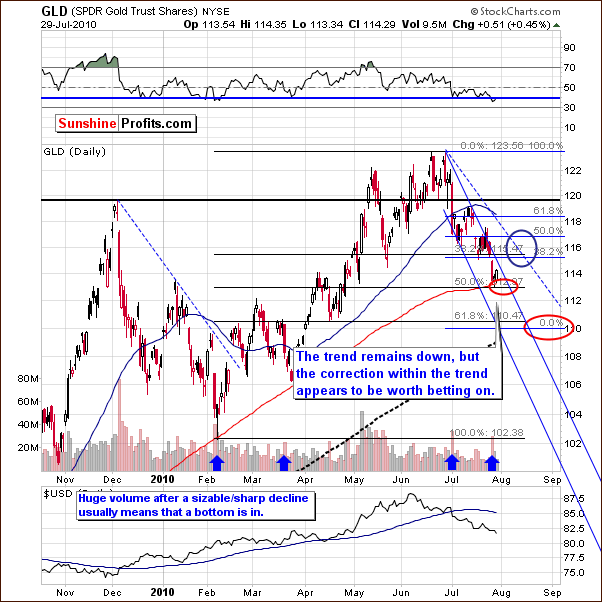
Moreover, based on Friday's close, the risk-reward ratio appears to be even more favorable than was the case when we've created the above chart. The next target, marked by the blue ellipse above is in the $115 - $117 level for GLD ETF. Higher levels are possible, but it is too early to set higher targets at this time. We will continue to monitor the situation and advise our Subscribers as warranted.
That's an important statement so we would like to emphasized it once again - based on Friday's intra-day action it seems that we might need to raise our targets for this rally, but we need some more information to do so.
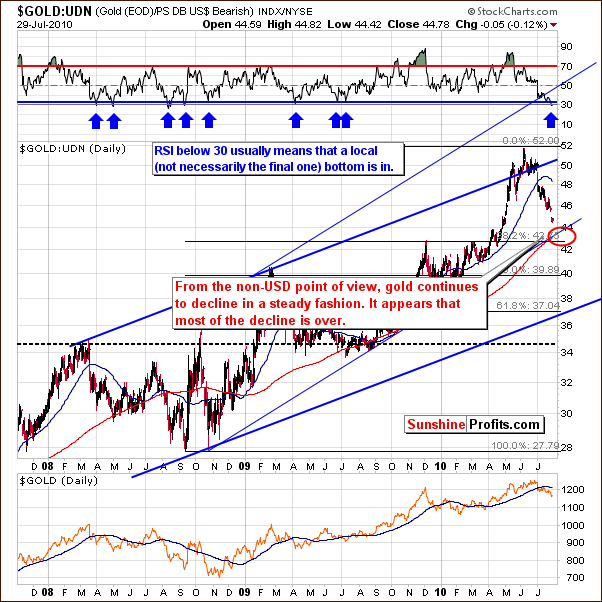
Looking at gold from a non-USD prospective we continue to see a steady decline in price. At this time however, it appears that most the decline is now over. The RSI has moved below 30 and this increases the probability that a local bottom is in. Further confirmation will likely be forthcoming and the bottom we are now close to is probably an initial local bottom and likely not the final one.
The lower section shows gold's daily price from our regular USD perspective. Please note that RSI based on the gold:UDN ratio works not only as a bottom indicator for the ratio, but also for gold itself.
Summing up, gold appears to be starting a contra-trend rally and it seems that it may be a good time to bet on higher prices in the short-term. The next likely target level for gold is $115-$117, possibly higher. Although $119.5 is a possibility, it does not appear very probable at this time.
To make sure that you are notified once the new features are implemented, and get immediate access to my free thoughts on the market, including information not available publicly, I urge you to sign up for my free e-mail list. Sign up today and you'll also get free, 7-day access to the Premium Sections on my website, including valuable tools and charts dedicated to serious PM Investors and Speculators. It's free and you may unsubscribe at any time.
Thank you for reading. Have a great weekend and profitable week!
P. Radomski
--
This week's Premium Update includes an extensive explanation and continuation of the points made in the July 27th, 2010 Market Alert. In addition to providing you with reasoning behind our latest (profitable) trading suggestion, we focus on where the current rally can take gold, silver and mining stocks (targets for both: ETFs and spot prices) and what can one expect to take place once this rally ends.
We have analyzed 16 charts/tables including ones dedicated to the Euro and USD Indices, both key precious metals - gold (also from the non-USD perspective) and silver, main stock indices, the HUI Index, the GDX ETF and the Gold Miners Bullish Percent Index. Moreover, we comment on the recent changes in our correlation matrix and a new development in the GDX:SPY ratio.
Additionally, we explain two questions from our Subscribers regarding trading frequency and option types.
We encourage you to Subscribe to the Premium Service today and read the full version of this week's analysis right away.
