
The vast majority of e-mails that we get from our Readers lately contains the question mentioned in the topic of this commentary, or it expresses the concern regarding the overall market trend. Should I buy gold now or wait for the bottom?, How low will the HUI go, whats your best guess?, Should I purchase gold and silver stock now or wait for them to go lower? are all repeated in the messages we received in the last several days. This itself usually proves to be a quite good indication that the bottom is near. After all, concern might be just another word for fear. It is typically best to make purchases, when fear has become really ubiquitous. It seems this might be the case right now.
Analyzing our correspondence is one thing, but since we want to examine the topic more thoroughly we will have to refer to charts. This essay features two HUI charts (courtesy of www.stockcharts.com). On the first one we take a closer look on the previous declines and try to extrapolate the tendencies to the current one. Understanding the structure of the previous falls might give us clues regarding the shape and the bottom of current one.
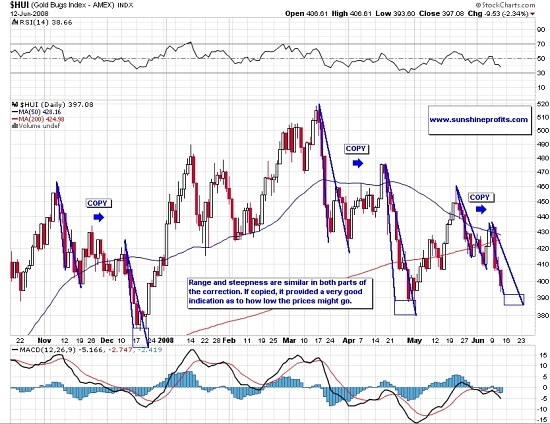
Please note that the downlegs are usually characterized by the ABC (also known as zigzags) patterns. What is the most important aspect of this fact, is that the C fall tends to be very similar to the A fall. There are two ways to look at the first decline. The first is to take into account only the initial, fast and very steep plunge. As such it is usually followed by at least a small rebound, after which the A decline tends to end slightly lower than it was prior to the small rebound. This local bottom marks the end of the A decline, as it would be viewed in the second way.
As mentioned earlier, the C decline is usually similar to A decline, but at which version of A one should look for clues? The answer is simple the one that works. It occurs that one time the C bottom materialized closer to the extrapolation of the first, initial version of the A decline, whereas the second time it was rather closer to the second version of the A decline. This is why we decided to mark whole areas which cover the range and time frame between extrapolations of both interpretations of the A decline. The rectangle that is created in this way is the target, for the end of this decline in the gold stocks.
Please note that we used one day space between drawing both lines from the last top. Intraday highs are really very similar in both days and either of them could be used for this analysis. We would rather have a relatively less precise target but with greater probability that is will contain the bottom than the other way around.
The second chart that features additional techniques used to confirm (or prove wrong) our initial target for this decline along with the last rectangle from the previous chart.

First, we would like to draw your attention to two support lines that could stop the decline somewhere near the 390 level. There are two lines, since one (solid) is created using intraday lows, whereas the second (dashed) one is drawn based on the closing prices. Using each has its own reasoning and supporters, so we are just going do use both of them. The general tendency is that the trend line drawn using intraday lows provides support for future intraday moves. The line drawn using closing prices provides respectively support for future closing prices. These lines are very close to the rectangle, meaning that they seem to confirm the 390 level as really important resistance.
Last tool featured in this commentary and on the chart above are the Fibonacci retracement levels. Please note that they are not used here as the retracement levels. They are applied on the chart above, as they are very convenient way to use the Phi (1.618...) number in the technical analysis. There are several reasons why this level is important in analyzing charts, the crucial one being probably that it often really works.
Here, we decided to use this number to check for similar patterns in the falls with regard to the beginning of the A decline and the local B top. We found that the price level calculated by multiplying the B A difference by 1.618 has one particularly interesting characteristic. The day the price broke down below that level marked either the bottom or the beginning of consolidation at very low levels. This means great buying opportunity. If this pattern is to be repeated in the future, then one might expect this opportunity to emerge shortly, as at the moment of writing this commentary, the price of the HUI is exactly on that particular level. This also corresponds to the conclusions one might have drawn after reading earlier part of this commentary.
Can you use the Fibonacci retracement level in this way? It worked in the past, so why not? The Phi (1.618) has multiple properties and uses. Nobody said that its only use in capital markets is to calculate retracement levels. On the contrary investors, speculators and analysts continuously try to find new uses of this particular ratio. Each market has its own unique properties. We are on a constant search for those on which we and our Readers can profit. This type of price behavior proved correct in the past and it usually pays to take into account the fact that the history might repeat itself at least to some extent.
There are more patterns in the last several days (head and shoulders, lower trend line of the current trend channel) which seems to confirm the above analysis, but we didnt include it in the chart above as it would make the whole picture too unclear.
Summing up, our best guess is that we are very close to the bottom and it makes a lot of sense to make at least your long term purchases right away. Timing the exact moment is speculation and should be viewed as such. This means that if you decide to wait for the bottom and try to catch it with some of your capital, make sure that this speculative position is not too big. Please refer to our Website for further details.
Of course the market might prove us wrong, as nobody can be right 100% of the time. Should our view on the market situation change substantially, we will send an update to our registered Users along with suggestions on how to take advantage of it. Register today to make sure you wont miss this free, but valuable information. Youll also gain access to our Tools section. Registration is free and you may unregister anytime.
P. Radomski
Back