

Gold moved about $30 last week and many investors view this fact as a bullish sign and indication that much higher gold prices are likely to follow. Is this really the case? Let’s take a look at the gold charts (charts courtesy of http://stockcharts.com).
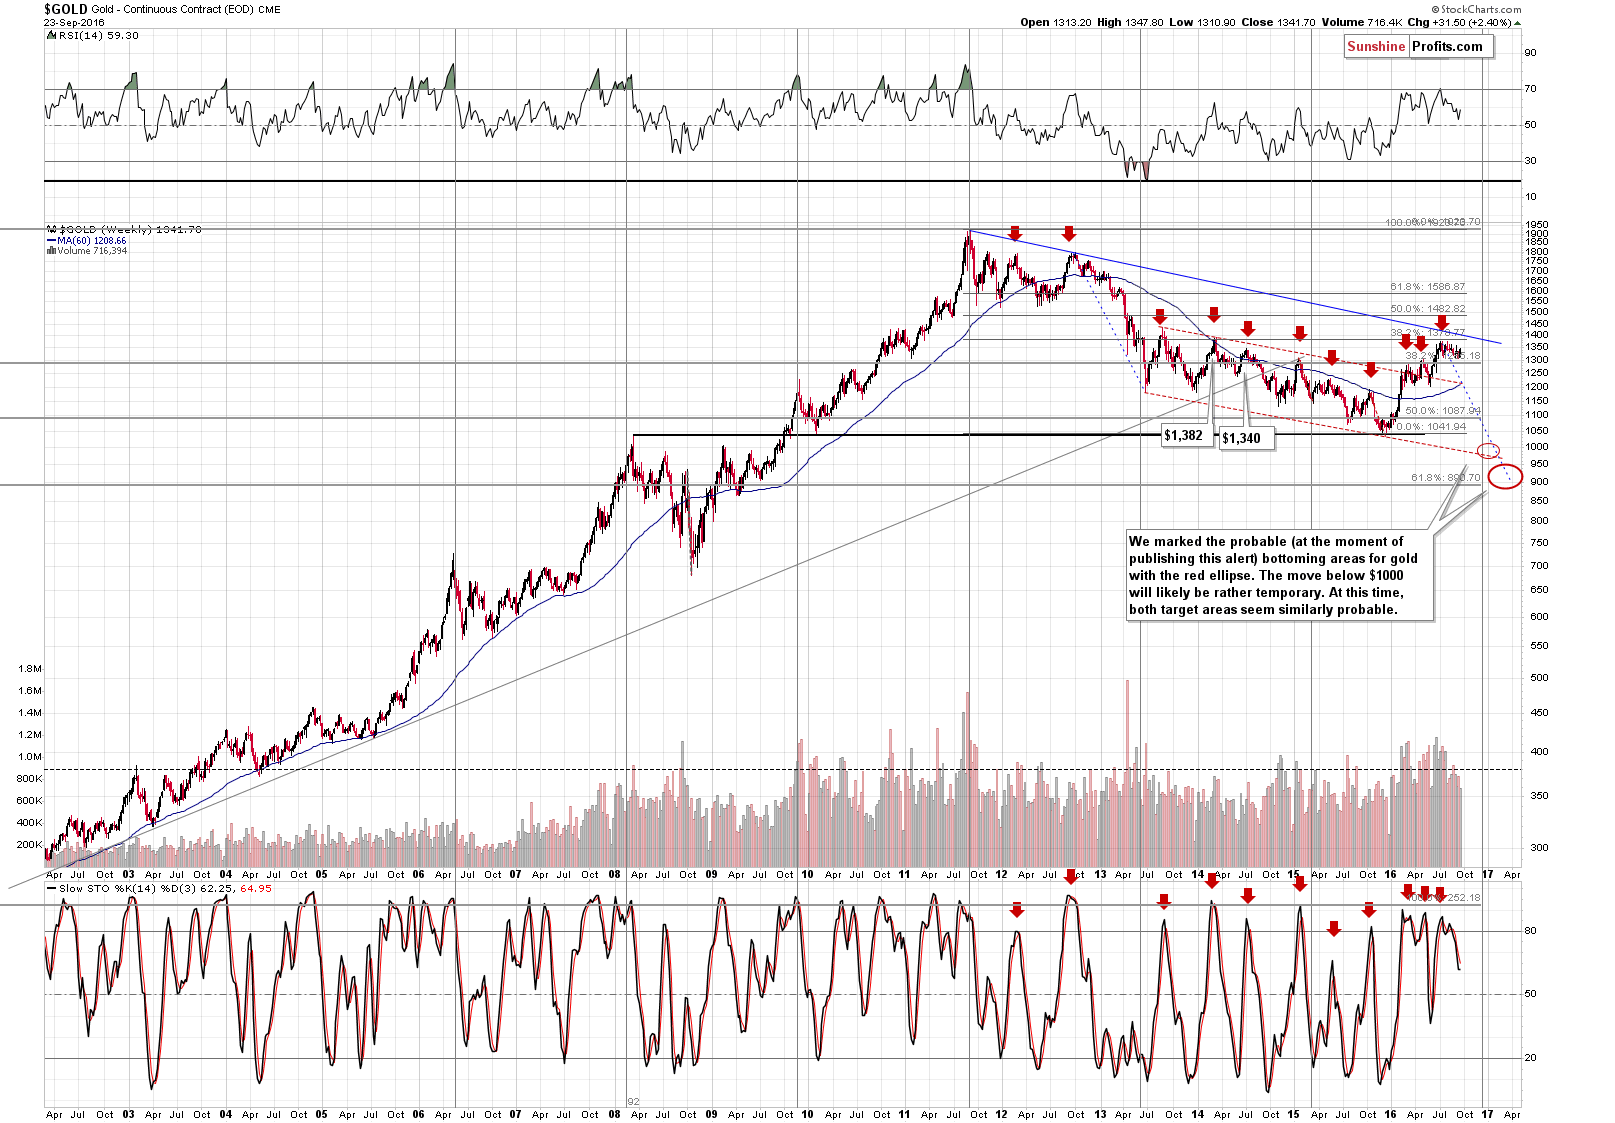
From the long-term point of view, not much changed despite a $30 rally. Gold is still consolidating after a sharp rally earlier this year and it’s quite likely to move much lower as this year’s entire rally was simply a correction to the 38.2% Fibonacci retracement level (based on the 2011 – 2015 decline). Please note that gold didn’t rally above the declining blue resistance line, so the medium-term trend remains down also from this perspective.
Moreover, please note that gold’s weekly rally took place on relatively low volume, which is a bearish sign for the following weeks.
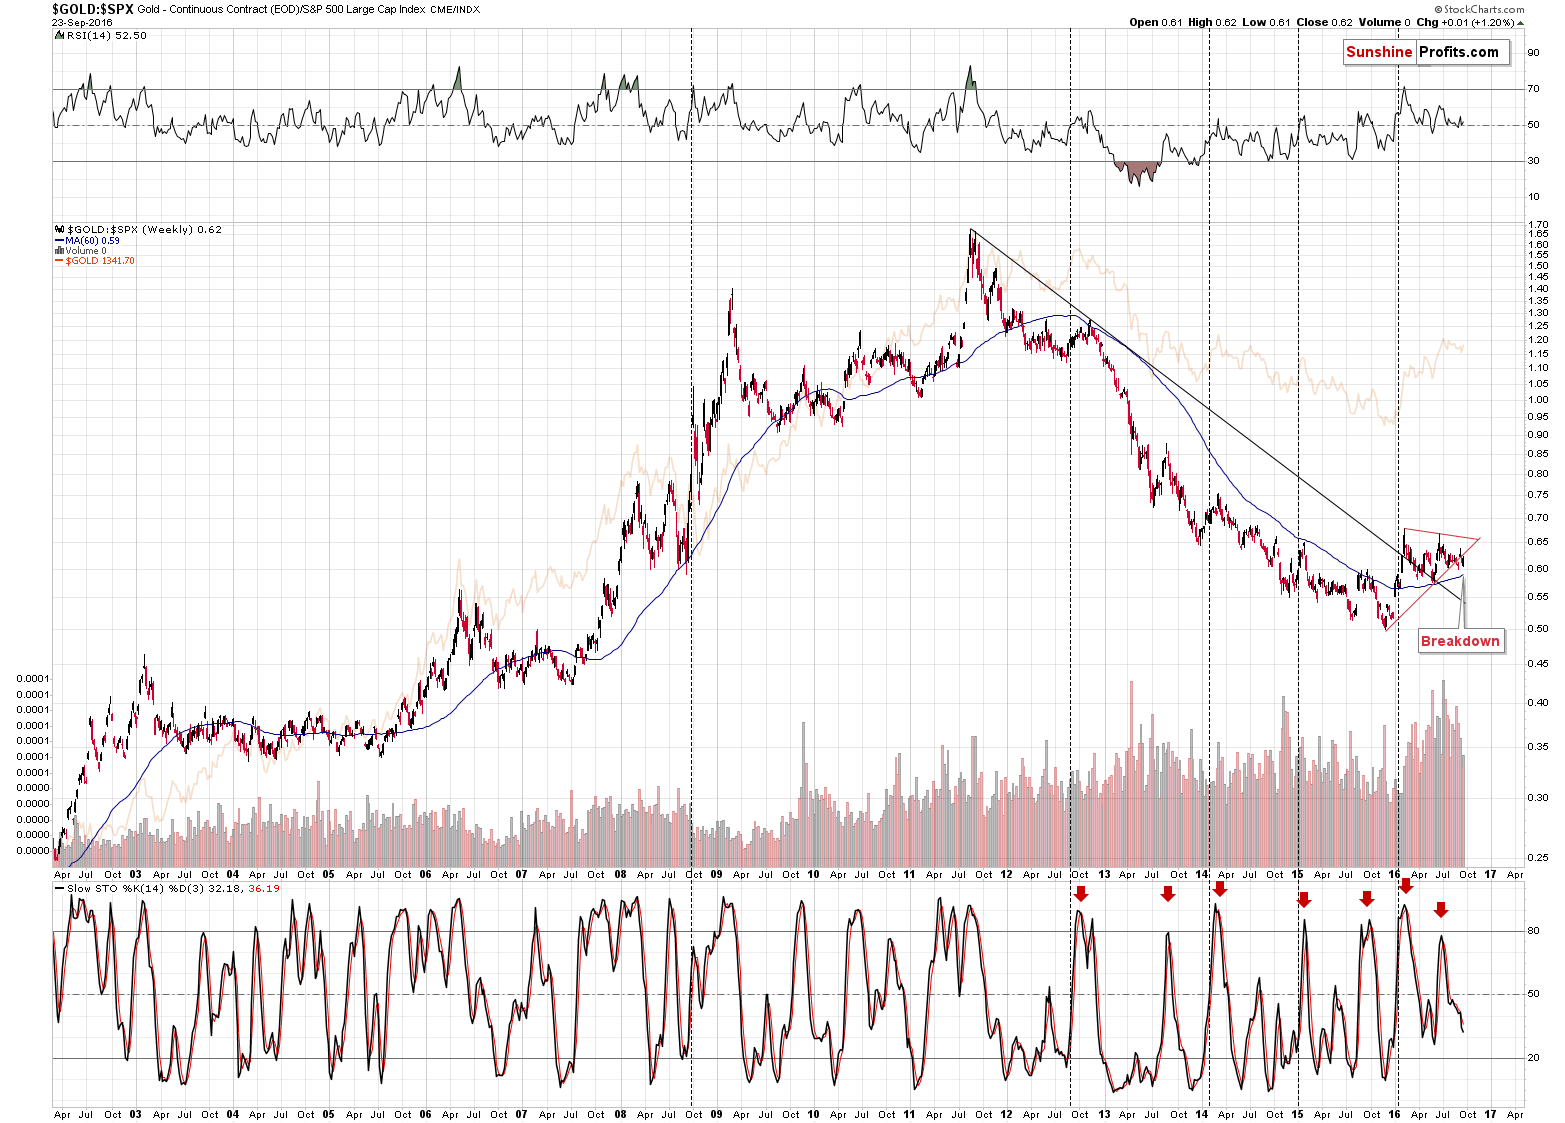
Comparing gold prices to stock prices shows that gold is already after a medium-term breakdown and the implications are bearish for the following weeks.
Gold’s move higher this year caused a rally in most of the important moving averages and this in turn seems to have generated some buy signals – at least at the first sight. In fact, we were just asked if it is a meaningful long-term buy signal that gold’s 24-week moving average moves above the 104-week moving average.
Even before looking at the chart, it seems quite doubtful that this particular set of moving averages would be effective as it appears rather artificial (24 and 104). The thing is that if a dataset is “tortured long enough, it will confess to anything”. So, if one keeps searching for the “optimal” version of the moving averages (or any other variable), they will ultimately find it, but it doesn’t mean that it is really the best one. Similarly, (as Nassim Taleb described in his Fooled by Randomness book) if you have an infinite number of monkeys with typewrites pressing the buttons, you will ultimately find a monkey (among many billions of other monkeys) that was able to write the exact copy of Homer’s Iliad. Would that make it likely to expect that this exact monkey will write Homer’s Odyssey next? No. There are techniques that can greatly increase the chance of obtaining the optimal values for moving averages and other variables (such as indicator parameters), but most traders and analysts are not aware of them and are not applying them. Consequently, we are always suspicious, when presented with a “special”, non-standard number in case of moving averages or indicators.
The second thing that the above resembles is the myth of supposedly bullish implications of the golden cross in gold and the bearish implications of the death cross in gold. You will find details in the above links (alternatively, search for these terms in the Dictionary section on SunshineProfits.com), but to make a long story short, they don’t work as they supposed to and as it is commonly believed.
Still, let’s take a look at the chart.
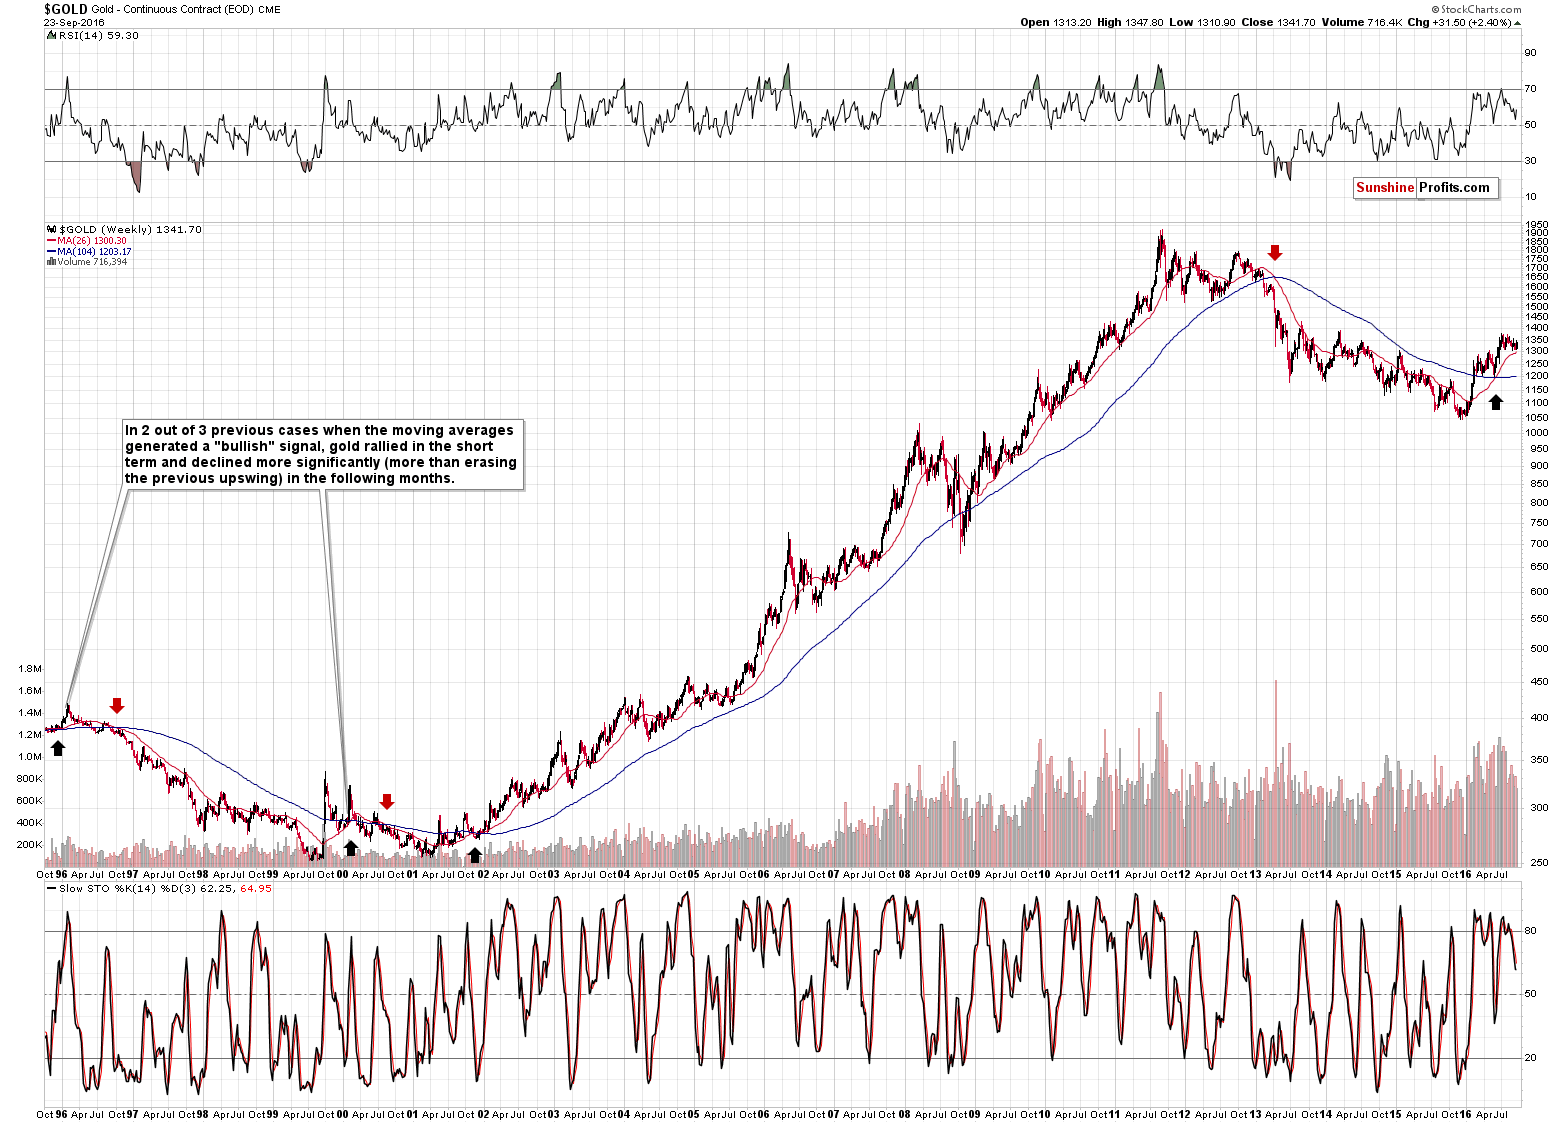
The “buy signal” is theoretically seen when the shorter moving average moves above the longer-term one. We saw 3 such cases in the past decades. One in late 1995, one in early 2000 and one in late 2001. In 2 out of 3 cases, we saw the following: gold rallied initially, then erased the entire rally and kept on declining for months. In the first case, gold moved below the previous lows (and moved to the final low of the bear market) and in the second case, gold moved very close to the previous bottom.
After the third time, gold rallied.
What happened after the signal this year? Gold rallied on a short-term basis, just like what happened in all 3 previous cases. However, in most previous cases, such rally was followed by even bigger declines, so the implications are somewhat bearish, not bullish. Why only somewhat? Because we have only 3 previous cases – it could simply be a more or less random kind of link, and it seems that we should focus on other signals and use the above only as a small confirmation of the bearish scenario. However, if we insist on implying something from it, the implications should not be bullish.
Summing up, even though gold rallied about $30 last week, it doesn’t seem it changed anything from the long-term point of view. Based on the breakdown in the gold to stocks ratio, the weak weekly volume and short-term indications that we have not covered in this free articles, it seems that the medium-term trend for gold remains down.
The above is up-to-date at the moment of posting this article and the situation can change in the following weeks. In order to stay updated on our latest thoughts on the precious metals market (including thoughts not available publicly), we invite you to sign up for our free gold mailing list. You’ll also get free 7-day access to our premium Gold & Silver Trading Alerts. Sign up today.
Thank you.
Sincerely,
Przemyslaw Radomski, CFA
Founder, Editor-in-chief, Gold & Silver Fund Manager
Gold & Silver Trading Alerts
Forex Trading Alerts
Oil Investment Updates
Oil Trading Alerts
