
Based on the April 29th, 2011 Premium Update. Visit our archives for more gold & silver articles.
There were plenty of silver linings this week. Silver moved close to the 1980 and the key barrier of $50 and gold is moving to new highs at the moment of writing these words. Before jumping right into gold and silver charts, lets take a few moments to examine the situation in the Euro Index, as it has been recently highly correlated with gold. We will start with the long-term chart (charts courtesy by http://stockcharts.com.)
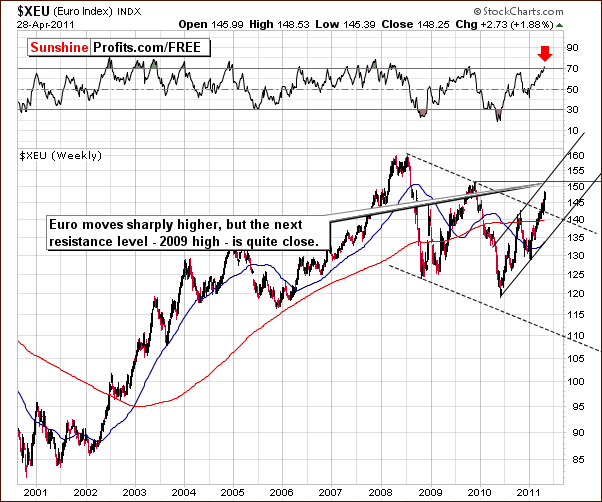
In the long-term Euro Index chart this week, we see a breakout above the declining trend channel. The Euro rallied soon thereafter and the question now is how far it will go? Taking the chart and RSI level into account, it appears that a move past the 150 level is possible with likely target area close to 152 (2009 high). This would coincide with the upper border of the rising medium term trend channel and would be in tune with an RSI showing an overbought condition as well.
Here, in this very long-term chart, the RSI may send a sell signal but we must keep in mind that this chart is based upon weekly index levels, not daily. Therefore, the point to sell could materialize in a week or two once this RSI sell signal is given.
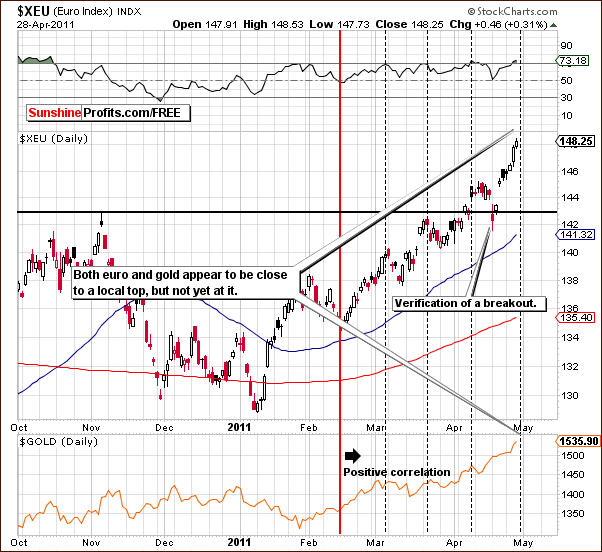
Looking at the short-term Euro Index chart, we see that both the Euro and gold, which are positively correlated, are approaching turning points. Although this is not precise, the indication is that risky territory is fast approaching. Caution is necessary, as both markets are likely to go higher in the following days, but not much longer.
Moving to the precious metals market, lets take a look how gold fared from the long-term perspective.
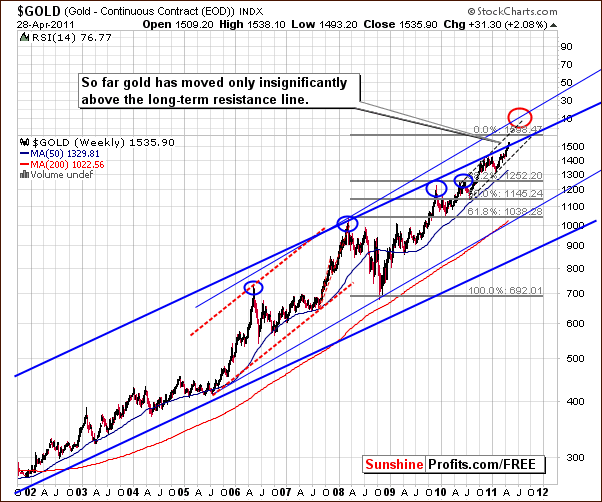
Unlike in many previous weeks, we have actually seen a new development this time. Note that a small move above the very long-term resistance line is seen, but with the index level just a little above this line, it is not yet cause for great excitement. Now what we would like to see is a continued uptrend, then a decline back to the support line on low volume and finally a continuation of the rally on significant volume.
Until a clear move is seen following the recent small move above the resistance line, it is not clear whether it is a breakout or a fake out so it must be monitored closely. In other words, this small breakout does not invalidate points made earlier.
Moving on to the silver market, we would like to provide you with a follow-up to our previous essay on silver price. In that essay we wrote that the top may be in, however based on the most recent bullish action in gold it seems that silver might indeed move somewhat higher. Please take a look below for details.
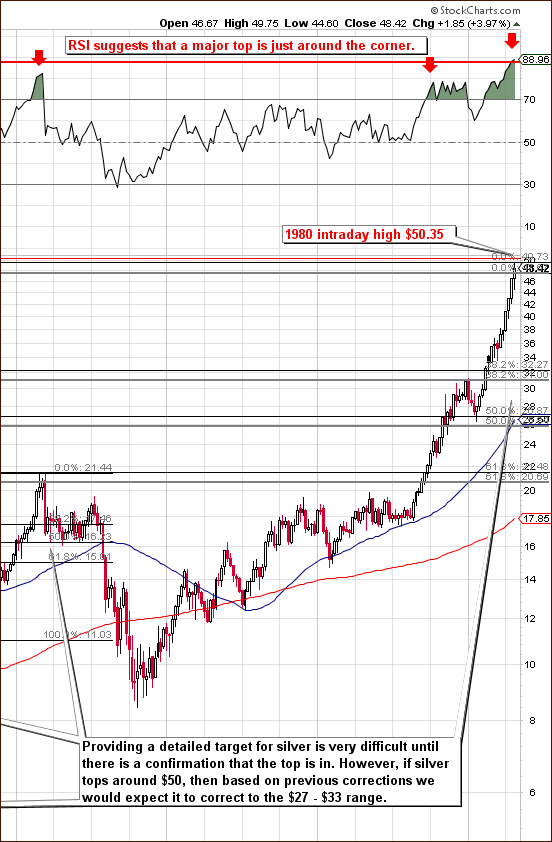
In the long term chart for silver this week, we can see just how precisely the target based on the Phi number 1.618 actually was. Although the $49.73 was not hit exactly, we saw the local top ($49.79) quite close to this level before the US markets opened on Monday.
On April 25th, 2011 we wrote the following:
If this top is going to be similar to the previous major tops that we've seen so far - and we view that as likely, then we will see significant volatility in the following days/weeks and probably a double top of some kind; please take a look at 2006 and 2008 tops in silver for more details. This means that there will probably be another chance to exit the market that would be accompanied by additional confirmations.
On April 28, 2011 we continued:
The volatility is clearly high and silver appears to be on its way to form above-mentioned "double top of some kind". Perhaps it would reach its record $50.35 intraday high. Yes, that is significantly higher from where silver is today, but please note that with this kind of volatility in the white metal, it will not be easy to exit one's position.
The next target level for silver, if it does move above its previous high, could be the 1980 high of $50.35. This should indeed provide a very strong resistance to silvers rally and without some new support, silver does not seem likely to make it here on its own. Perhaps with soaring stock market and gold moving to new highs, this could be seen but it does not appear at this time to be very likely. Indications are that the local top is close.
Still, given the current volatility (which is not likely to decrease soon) in the silver market, it seems that confirmations from other markets will be key to properly assessing whether the final top is in or not. We will leave this part of the analysis to our Subscribers.
Before summarizing, please take a look at one of our indicators that flashed a buy signal recently.
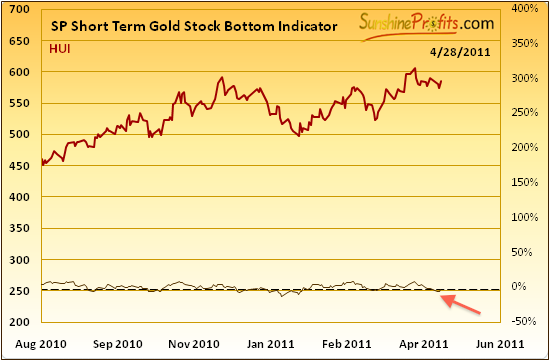
Our indicator detecting short-term bottoms has flashed a buy signal on April 27th, 2011 which - given its previous performance - is something that should not be ignored.
This indicator did a good job of signaling i.a. the March bottom and also the prior one seen in January February to name only a few. We were likely at a short-term bottom in the precious metals sectors (right after Monday/Tuesday decline), but please note that this indicator has a short-term nature meaning that it was designed to detect short-term moves. Consequently, the only thing that should be inferred based on the buy signal is that the precious metals sector is likely to rally in the following days. Nothing more and nothing less it does not tell us whether or not the rally will continue for more than just several days, nor does it tell us if gold stocks will move above their previous highs.
Summing up, combining the above information with other points made in this essay regarding gold, silver, and euro it seems that the whole precious metals sector is about to move at least a little higher (the risk/reward ratio being most favorable for gold), but the turnaround is just around the corner.
Thank you for reading. Have a great weekend and profitable week!
P. Radomski
--
Gold stocks are clearly not following gold higher. What does it mean and how should you position yourself given this important factor? Is the final top for silver really in or can it rise even higher (updated version of last week's silver megachart provides details)? Meanwhile, the USD Index is plunging and euro is soaring - what is the likely impact on gold prices in short- and medium-term? One of our indicators has just flashed a signal - something is definitely in the works, and today we explain how one should interpret this signal.
Totally new Sentiment Analysis section is being featured today - in turbulent times this tool becomes particularly useful, and this week we feature a specific way of reading sentiment that allows you to prepare for trades considerably earlier than it would be the case without using type of analysis.
Finally, today's update includes a Previous Tops section where we dig deep into patterns seen right before previous major tops - clearly there are many similarities. The most important point is that there was a particular final exit signal that we've seen in both 2006 and 2008 - being aware of this signal right now appears invaluable.
We encourage you to Subscribe to the Premium Service today and read the full version of this week's analysis right away.
