
Visit our archives for more gold & silver articles.
The Dow Jones Industrial Average climbed a steep wall of worry and last Tuesday returned to its all-time high from late 2007. The Dow finished at 14253.77, topping the previous record set in October 2007 and is already up 8.8% for the year. The Fed’s expansive monetary policy to prop up the economy has kept stocks climbing higher despite a less than glowing global economy. By pumping trillions into the financial system, the Fed has convinced investors it will provide a safety net for future shocks. In addition, by keeping interest rates extremely low, the Fed is forcing investors to seek higher returns in the stock market.
The financial press is hailing it a historic day.
But we suggest stopping a moment before chilling the champagne. Despite reaching its all-time high, the stock market has provided investors with zip, zilch, zero return over the last five and one-half years. The Dow has just gotten back to where it was in October 2007 and many investors are still struggling to make up their losses after the credit crisis that erased $37 trillion from global equity values. When the housing bubble burst in 2008 the DOW plunged 34 percent in 2008 for the worst performance in 77 years.
During the five and a half year period since the crisis, gold has provided a return of approximately 119%.
We don’t mean to dump cold water on the celebration. We just want to keep things in perspective. Once we factor in inflation over the past few years, the all-time high looks less convincing. With consumer-price increases removed, the Dow has not been in real record territory in more than 13 years. A Wall Street Journal article contends that the last real, or inflation-adjusted, Dow record was on Jan. 14, 2000. Since then it looks like the Dow has risen 22% if you don’t take inflation into account. But if you do, Tuesday’s high is still more than 10% below that record.
Tuesday's close is just 9256.38 once inflation is removed. That doesn't even match the inflation-adjusted high of 10194.80 hit in 2007 – and we’re only taking the official inflation numbers into account here. And it is far from the real record of 10424.28 hit Jan. 14, 2000, according to calculations by Bespoke Investment Group.
Inflation is definitely something to take into account when investing to meet future needs. Central bankers can print all the fiat currency they like but they can’t manufacture gold. Its supply is more or less fixed (discoveries are made, but you can’t suddenly increase gold production by 500% and you can do that in case of fiat currencies). It cannot be inflated by central banks, which is why it is considered an inflation hedge and the ultimate alternative currency (or the only true one). The reason a glass of soda cost a penny in the beginning of the last century and now costs several dollars is not that soda water was cheaper then, but rather that the dollar had more value.
Some of the big hedge funds still are betting on the price of gold, even though a large number have sold most in the last quarter of 2012 (who knows if that happened in the past few weeks when volume was so high…), if not all, their shares in SPDR Gold Trust ETF (GLD -0.09%). Hedge fund manager John Paulson and his firm, Paulson & Co., remain solidly in the gold camp. Paulson continues to hold the largest position in GLD with nearly 22 million shares, worth an astonishing $3.344 billion.
Let’s see what’s next. We’ll start the technical part of today’s essay with the analysis of the USD Index medium-term chart (charts courtesy by http://stockcharts.com.)
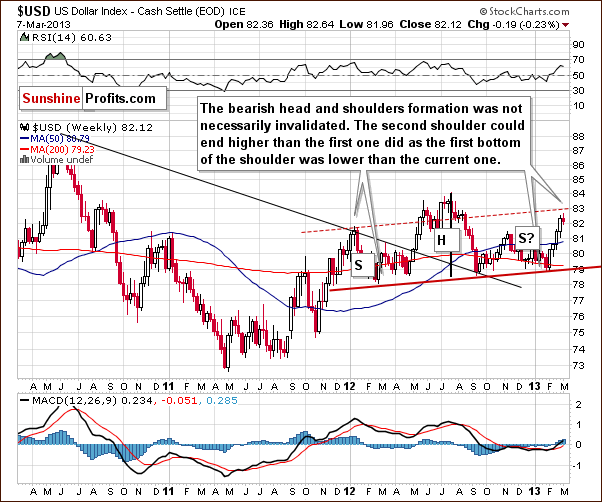
The important thing to discuss here is the head-and-shoulders formation. This trading pattern has bearish implications for the USD Index and the question now is whether the formation is still present given the recent rally. We feel the answer is “yes”, because even though the index is now higher than the level of the left shoulder, the full formation is simply a bit skewed.
Local bottoms have been a bit higher each time so it is perhaps quite natural for the second shoulder to be above the first shoulder. Consequently, the formation could still be completed - though not yet - the other shoulder has yet to form. Declines in the index are needed for this to happen, and we feel this could still be seen.
Let’s take a look at the intermarket correlations to see how this rather bearish outlook for the dollar could translate into gold and silver prices.
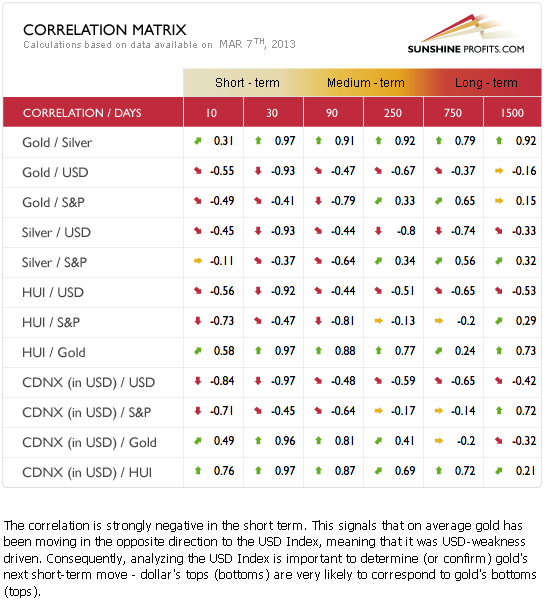
The Correlation Matrix is a tool which we have developed to analyze the impact of the currency markets and the general stock market upon the precious metals sector, (namely: correlations between gold and other assets). The precious metals and the USD Index show a strong, negative correlation for the past 30 days. In the last several days however, gold prices did not continue their decline, that is, did not respond to the USD Index strength. This is a bullish combination and provides an indication that gold prices will rally if the dollar declines significantly (!). It also suggests that additional small (!) daily rally in the USD Index may not really hurt the price of gold (just like it was the case on Friday).
Speaking of gold, let’s take a look at the yellow metal from the long-term perspective.
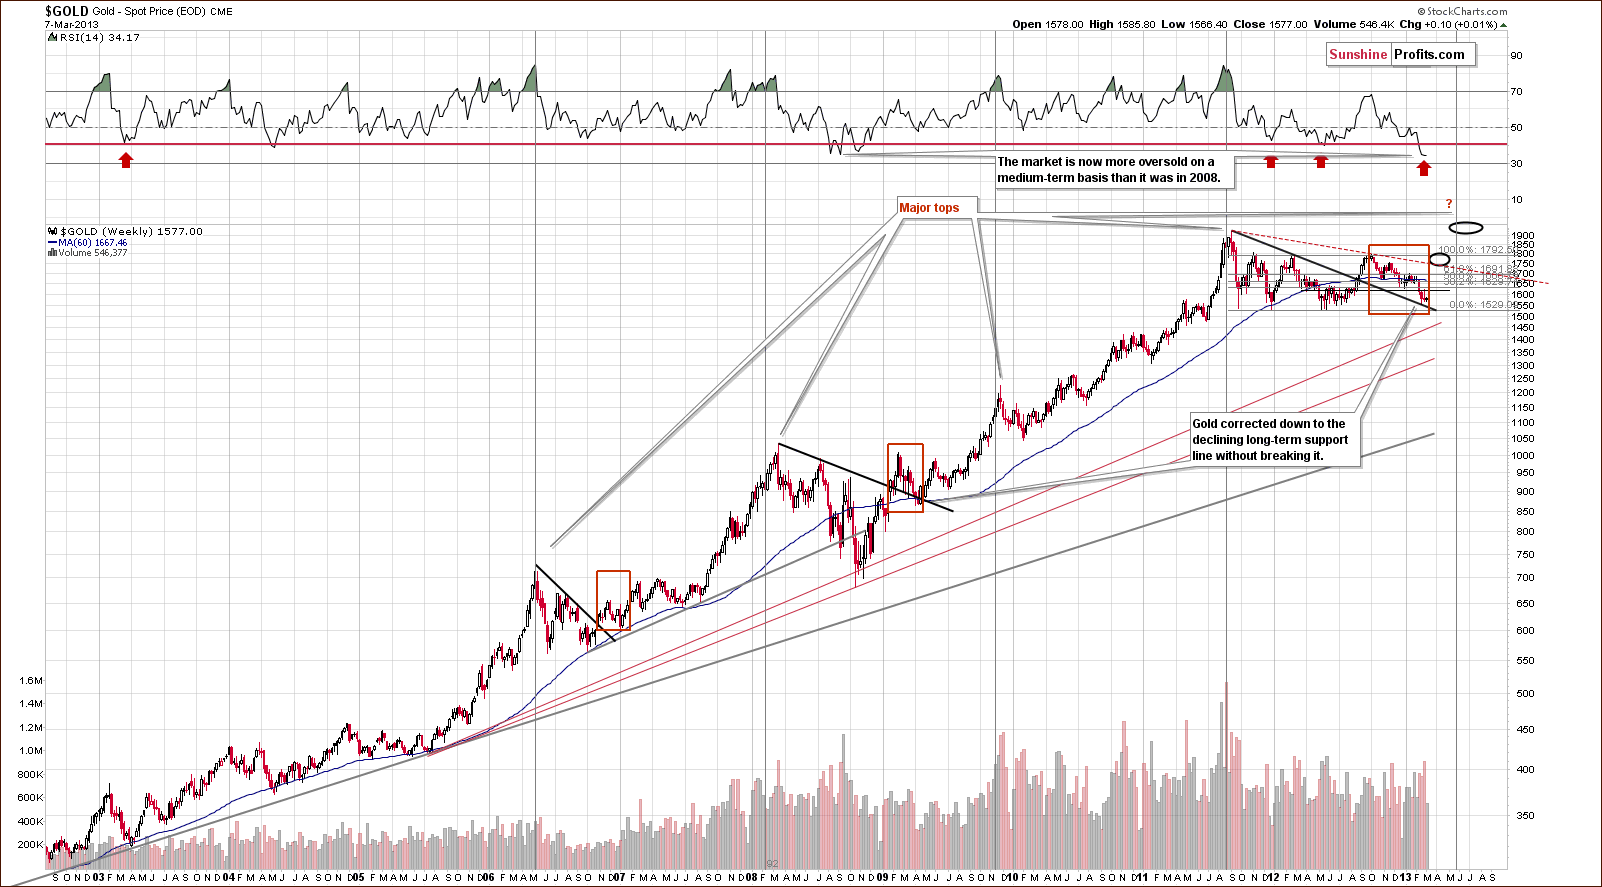
In this chart, very little change was seen, compared to two weeks ago. Gold’s price moved $0.10 higher last week, an increase of 0.01%, basically flat. With USD Index values moving up a bit last week, the situation isn’t all that bad here. It seems that gold prices bottomed in late February by correcting to the declining support line seen on the above chart.
RSI levels continue to describe the situation as very similar to 2008 when a major bottom formed. Back then, it took just a few months for gold to rally from about $700 an ounce to $1,000 an ounce. If a similar percentage increase is seen this year, gold could rally to $2,250 in just a few months (that’s not our official target, though). This appears possible based on the long-term cycles still present here as indicated by the vertical lines in our chart.
Summing up, although the cyclical turning point has passed for the USD, it still seems as though the index will soon reverse and move to the downside as it is now considerably overbought on a short-term basis. If the coming decline turns into a bigger one and the medium-term head-and-shoulders pattern is completed, it will likely translate into higher gold and silver prices. For now the bullish piece of information is that gold doesn’t seem to react to daily rallies in the USD Index.
Gold appears poised to move to the upside but the exact timing of such a move is still not crystal clear. Some indicators point to higher prices quite soon, there’s a possibility of a very sharp rally over the next few months, and it’s also possible that nothing major will happen for a week or two.
Thank you for reading.
Sincerely,
Przemyslaw Radomski, CFA
PS. Did you know that our subscribers receive Market Alerts at least on a daily basis in addition to the weekly, in-depth Premium Updates? We encourage to you to stay up-to-date regarding the gold and silver price moves as well.
Back