

The intent of this page is to show you the simulated (hypothetical) returns of precious metals portfolios for the past decade,* in order to check how all of them performed individually, and how a portfolio consisting of them would have fared. We will then check how changing the positions according to our signals (as described in Gold & Silver Trading Alerts and Premium Updates – which is how the former used to be called in the past) for the long-term investment capital would have impacted the results. We simply want to show you two things:
- We are very far from being either permabulls or permabears.
- We have been creating quite a lot of value for long-term precious metals investors.
The final extra step will be to check how the selection of individual mining stocks (based on the Golden StockPicker, and Silver StockPicker), strategic rebalancing and varying exposure would have affected the portfolio.
* - To be precise, we will use data that starts on March 27th, 2009, because that’s when we posted our first premium analysis dedicated to the precious metals sector. The ending date for our calculations is August 31, 2018.
After appetizers, let’s move on to the main analytical course.
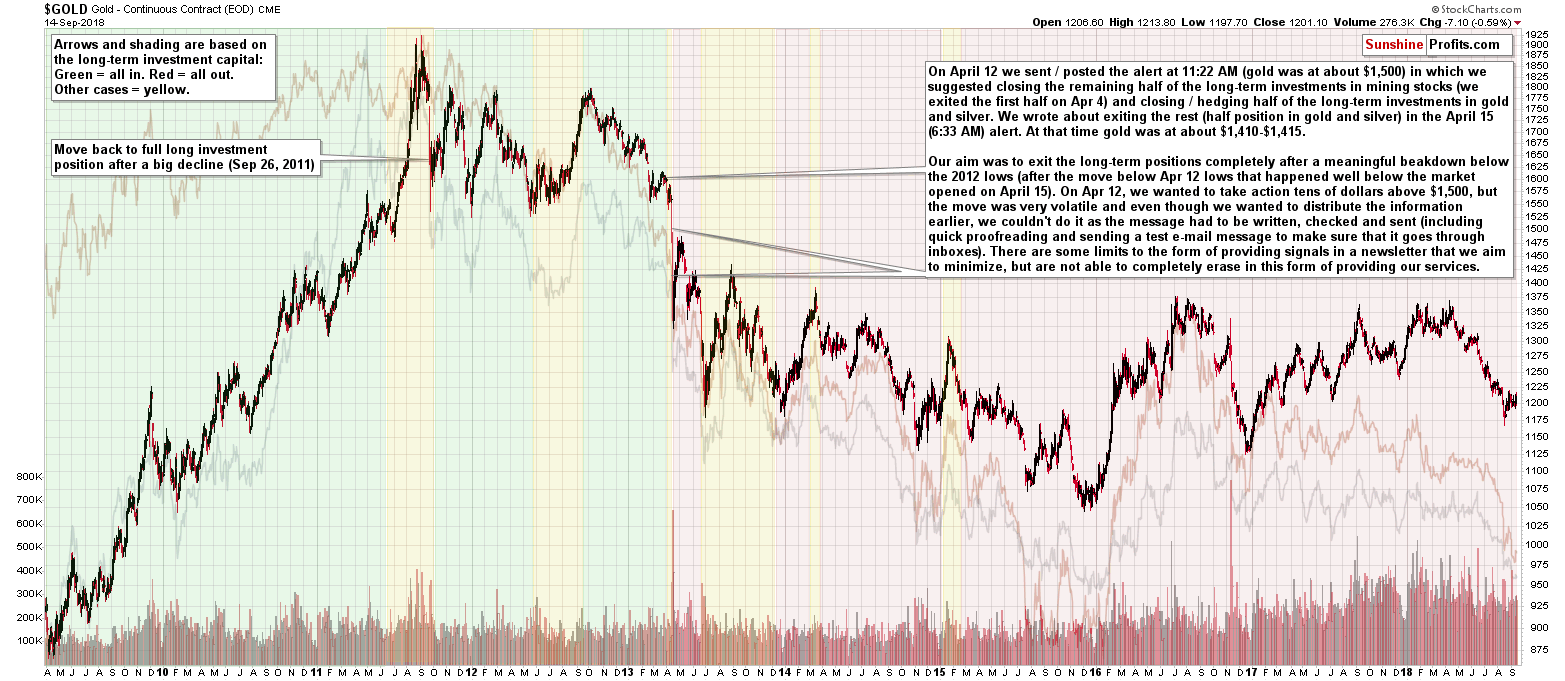
The above chart features:
- Gold – the most visible price movement, shown as candlesticks.
- Silver – less visible price movement, shown as a silver line.
- HUI Index (proxy for mining stocks) – less visible price movement, shown as a brown line.
- Green-shaded areas – times, when we wrote about full long-term investment positions in gold, silver, and mining stocks (sometimes also in platinum).
- Yellow-shaded areas – times, when we wrote about being partially in the precious metals market with long-term investments (this includes moments when we were long just one part of the precious metals market, moments when we were long everything in the PM market except for one part, and all cases in between).
- Red-shaded areas – times, when we wrote about being completely out of the precious metals market in the case of the long-term investment capital.
- Descriptions of our views during volatile declines seen in September 2011 and in April 2013.
The above chart should be clickable, but if it’s not, here’s a direct link to it:
Let’s talk performance.
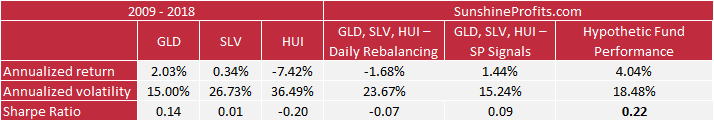
First let’s see how the gold, silver and mining stocks fared. We use the GLD ETF as a proxy for gold, the SLV ETF as a proxy for silver and the HUI Index as a proxy for mining stocks.
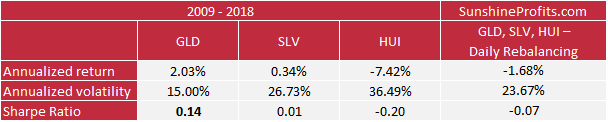
The last column shows the buy-and-hold portfolio created by investing 1/3 of one’s assets in gold, 1/3 in silver, and 1/3 in the mining stocks from the HUI Index (with weights as in the index). We assume daily rebalancing, which means that on each day, the 1/3, 1/3, 1/3 structure is preserved.
The table presents annualized average returns, standard deviations and Sharpe ratios. This last measure shows how much return a given portfolio would have generated for one unit of volatility. In other words, it balances returns and volatility. The higher the Sharp ratio, the more return per volatility the portfolio would have generated. In many cases, market professionals decide which portfolio is better by looking at their Sharpe ratios.
We notice immediately that the hypothetic portfolio results are far from spectacular as there is a substantial drag on performance from mining stocks. Overall, the returns on the diversified (1/3, 1/3, 1/3) buy-and-hold portfolio would have been negative, while the returns on gold or silver alone would have been positive. So, perhaps, rebalancing daily without any other considerations is not the way to go.
Now, here’s how one’s portfolio would have fared if they had moved in and out of the precious metals market according to the signals for the long-term investment capital from our Gold & Silver Trading Alerts and Premium Updates.
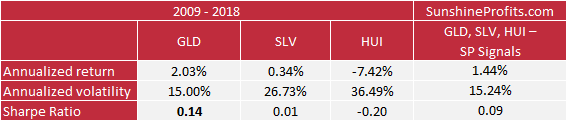
As previously, we use proxies. The last column shows the performance of the portfolio created by investing 1/3 of one’s assets in gold, 1/3 in silver, and 1/3 in the mining stocks from the HUI Index (with weights as in the index). In this case, however, instead of simply rebalancing daily, one limited and/or exited the positions in gold, silver and mining stocks when we wrote about it in our analyses. In other words, we add the signals from our Gold & Silver Trading Alerts into the mix. Precisely, we are taking into account the signals for the long-term investment capital. As you can see, compared with the previous table, the Sharpe ratio has improved dramatically, as the rate of return became positive, while volatility (annualized volatility, a.k.a. “risk”) declined.
When crunching the numbers, it wasn’t clear which price we should use for the April 12 / April 15, 2013 exit as we wrote about exiting the long-term investments completely well before the markets opened in the U.S. on April 15, when gold’s price was substantially above the price at which it closed on that day. So, while using April 12th, 2013 closing price might be too optimistic, it seems that using the opening price of April 15th, 2013 session would be too conservative. Consequently, we used an approach which aims to average these prices. There were no other similar adjustments in the dataset and closing prices are used in all other cases. The details described in this paragraph will be applicable also for the portfolio that we will provide later on.
Moving back to the above table, as you can see, our analyses greatly increased the overall rate of return relative to basic, daily rebalancing. If we take the portfolios’ risk (measured by volatility) into account and view the results in terms of the Sharpe ratios, we see that the portfolio that is based on our analyses is not only a significant improvement over the naïve version but also over investing in silver alone.
Does it mean that buy-and-hold strategy for gold is superior to a managed and diversified portfolio including more parts of the precious metals sector? Not necessarily. During most of the analyzed period, PMs and miners were declining, which means that the less volatile part of the precious metals market simply doesn’t decline as much as the other ones. But, once the bull market truly resumes, the more volatile parts of the precious metals market would be likely to take the lead.
The chart below compares two diversified portfolios that were rebalanced daily. The only difference between them is that one takes into account our comments on the long-term investment capital, and the other one doesn’t. We also present the results of investing in GLD, SLV and the HUI Index (in the chart’s background) for comparison.
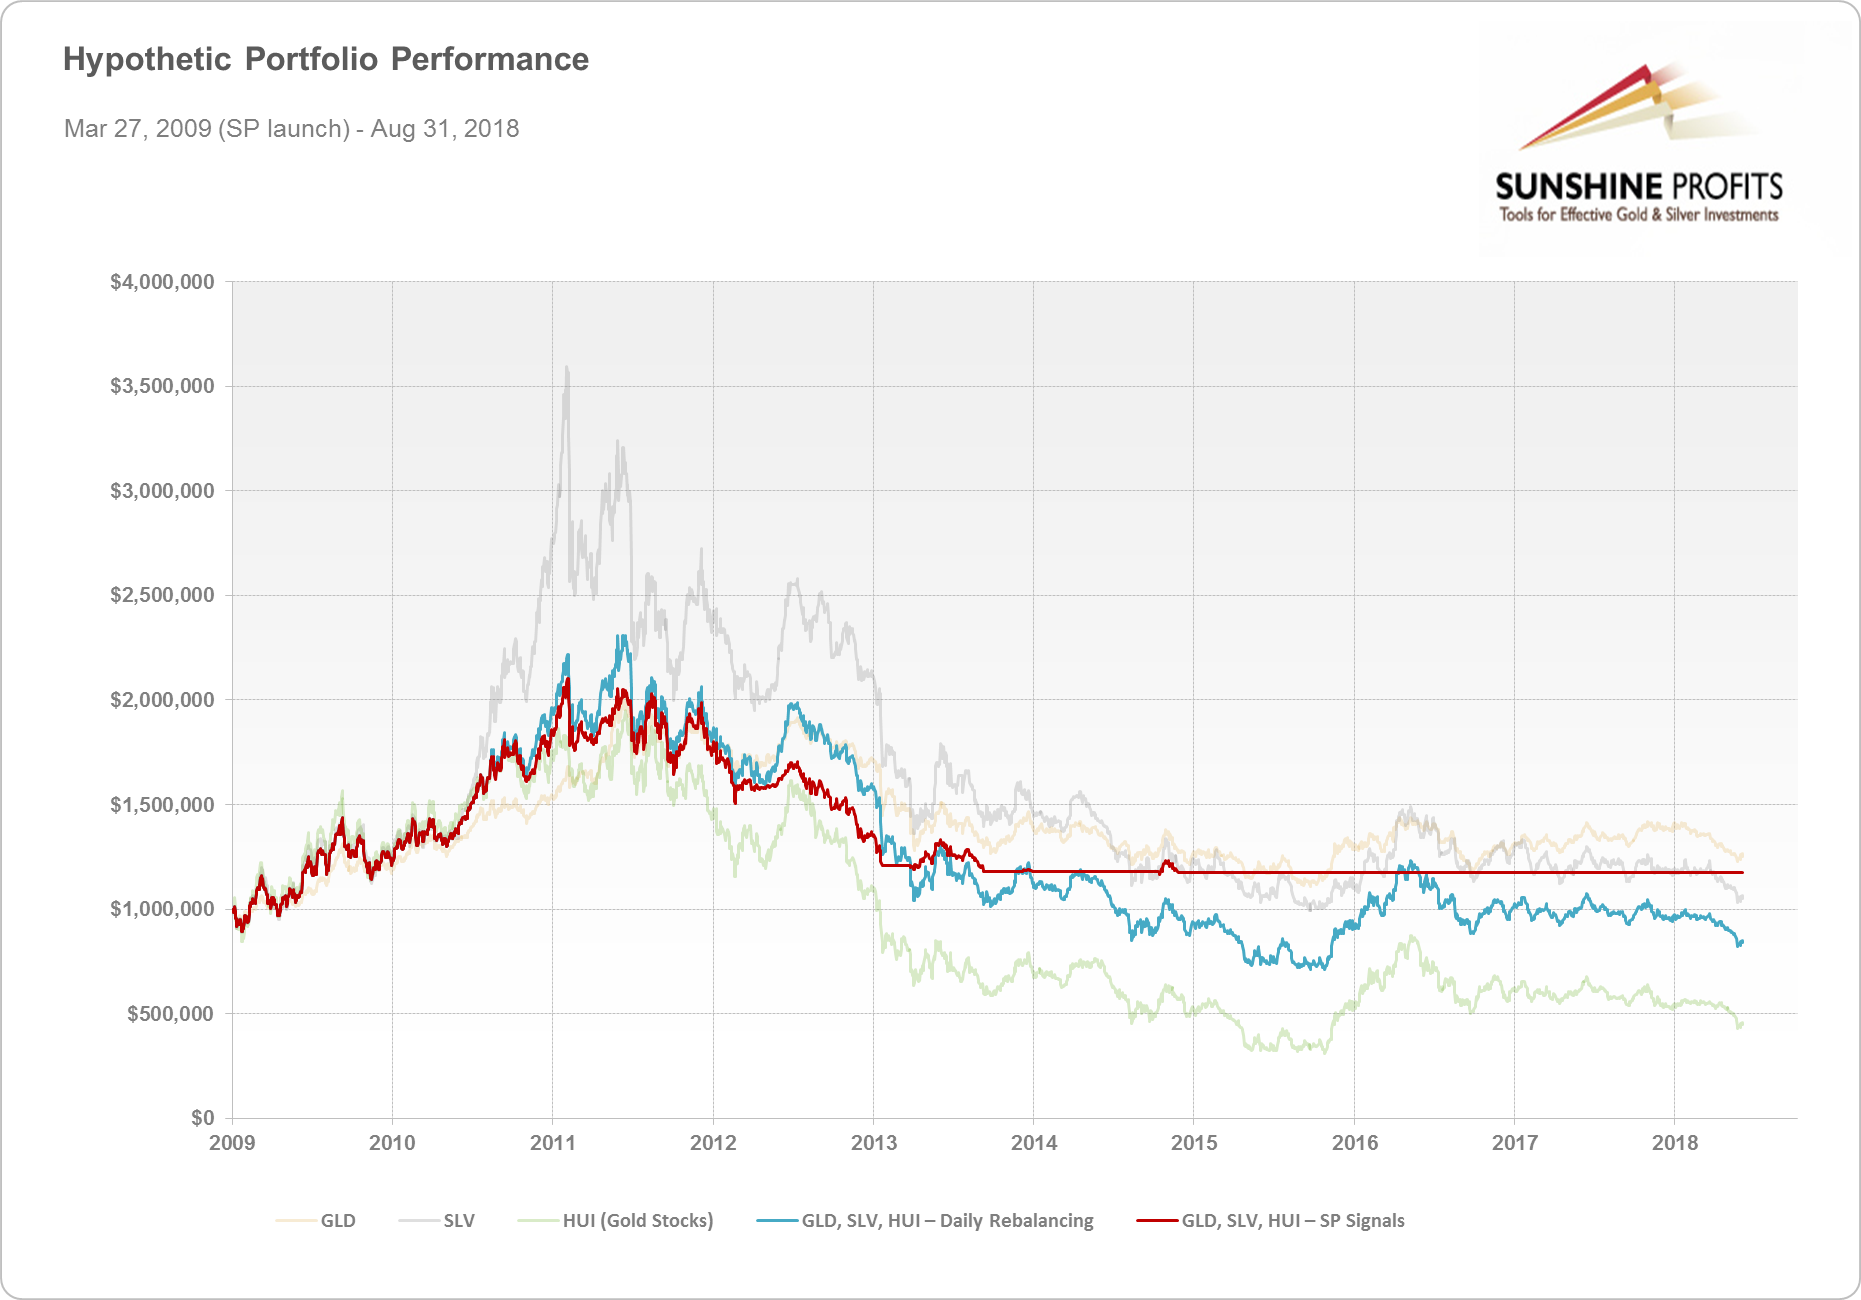
The red line clearly outperforms the blue one, so it’s quite obvious that we have generated value for the long-term investors over the years, relative to: investing in mining stocks alone, investing in silver alone, and basic daily rebalancing of a diversified portfolio. The results are comparable with investing in gold alone. And this is based on the assumption that we use the signals from Gold & Silver Trading Alerts alone and don’t use any other tool or technique that we provide.
As indicated earlier, we will also show you how the diversified portfolio’s results would have looked if we had also applied other techniques that we featured (in addition to following the signals dedicated to the long-term investment capital from our premium analyses).
In this case, the portfolio will be a bit different – it will include not only gold, silver, and gold stocks, but also silver stocks. Effectively, we are increasing the overall share of mining stocks (from 1/3 to 1/2), which – as you saw earlier – should make things harder for us, because mining stocks were the part of the PM sector that underperformed in the analyzed period.
The portfolio below is based on the individual senior mining stock selection based on the Golden StockPicker and the Silver StockPicker and rebalancing based on our in-house developed algorithm. The rebalancing is not daily or based on certain time cycles, but on how much the portfolio deviates from its original structure. When done right, and using good mining stock selection techniques, rebalancing can significantly boost returns and the same can be said about the entire portfolio.
As before, we will also include the signals from our Gold & Silver Trading alerts. This means that we vary the exposure to different parts of the precious metals market based on our analyses according to a specific schedule.
To be precise, whenever we wrote about being in with a specific part of the portfolio (for instance gold), then we assume being 100% in. Whenever we wrote about being out with a specific part of the portfolio (for instance gold), then we assume being 0% in. All other indications are approximated to 50%. These calculations are done separately for gold, silver, and mining stocks as these were the parts of the precious metals sector that we included in the PM portfolio throughout the entire analyzed period and that we plan to invest in going forward. Overall, it seems that the described level of detail in our calculations is more than sufficient for them to be reliable.
We are including this schedule, because we want to show you what kind of performance might have been seen if one had used our services as an actively managed proxy for long-term precious metals investments.
We compare the previous two portfolios (basic daily-rebalanced portfolio and the daily-rebalanced portfolio that’s based on our long-term signals) to one that’s based on our long-term signals but that substitutes daily rebalancing with more sophisticated rebalancing techniques. Additionally, this portfolio includes the results of our mining stocks selection tools. In sum, the mentioned portfolio is the previously described actively managed (GLD, SLV, HUI) portfolio that additionally includes silver stocks, and that benefits from our mining stock selection techniques and in-house developed rebalancing. It does not include any other sources of outperformance that we have developed.
To be precise, it’s not longer just a portfolio, but rather an entire management strategy that might have been achieved, so in the table and chart below we will call it “hypothetic fund performance”. To be clear, it’s not the final performance as it doesn’t cover transaction costs and taxes, but all the other simulated returns that we have discussed so far didn’t cover them either, so comparing them is still justified.
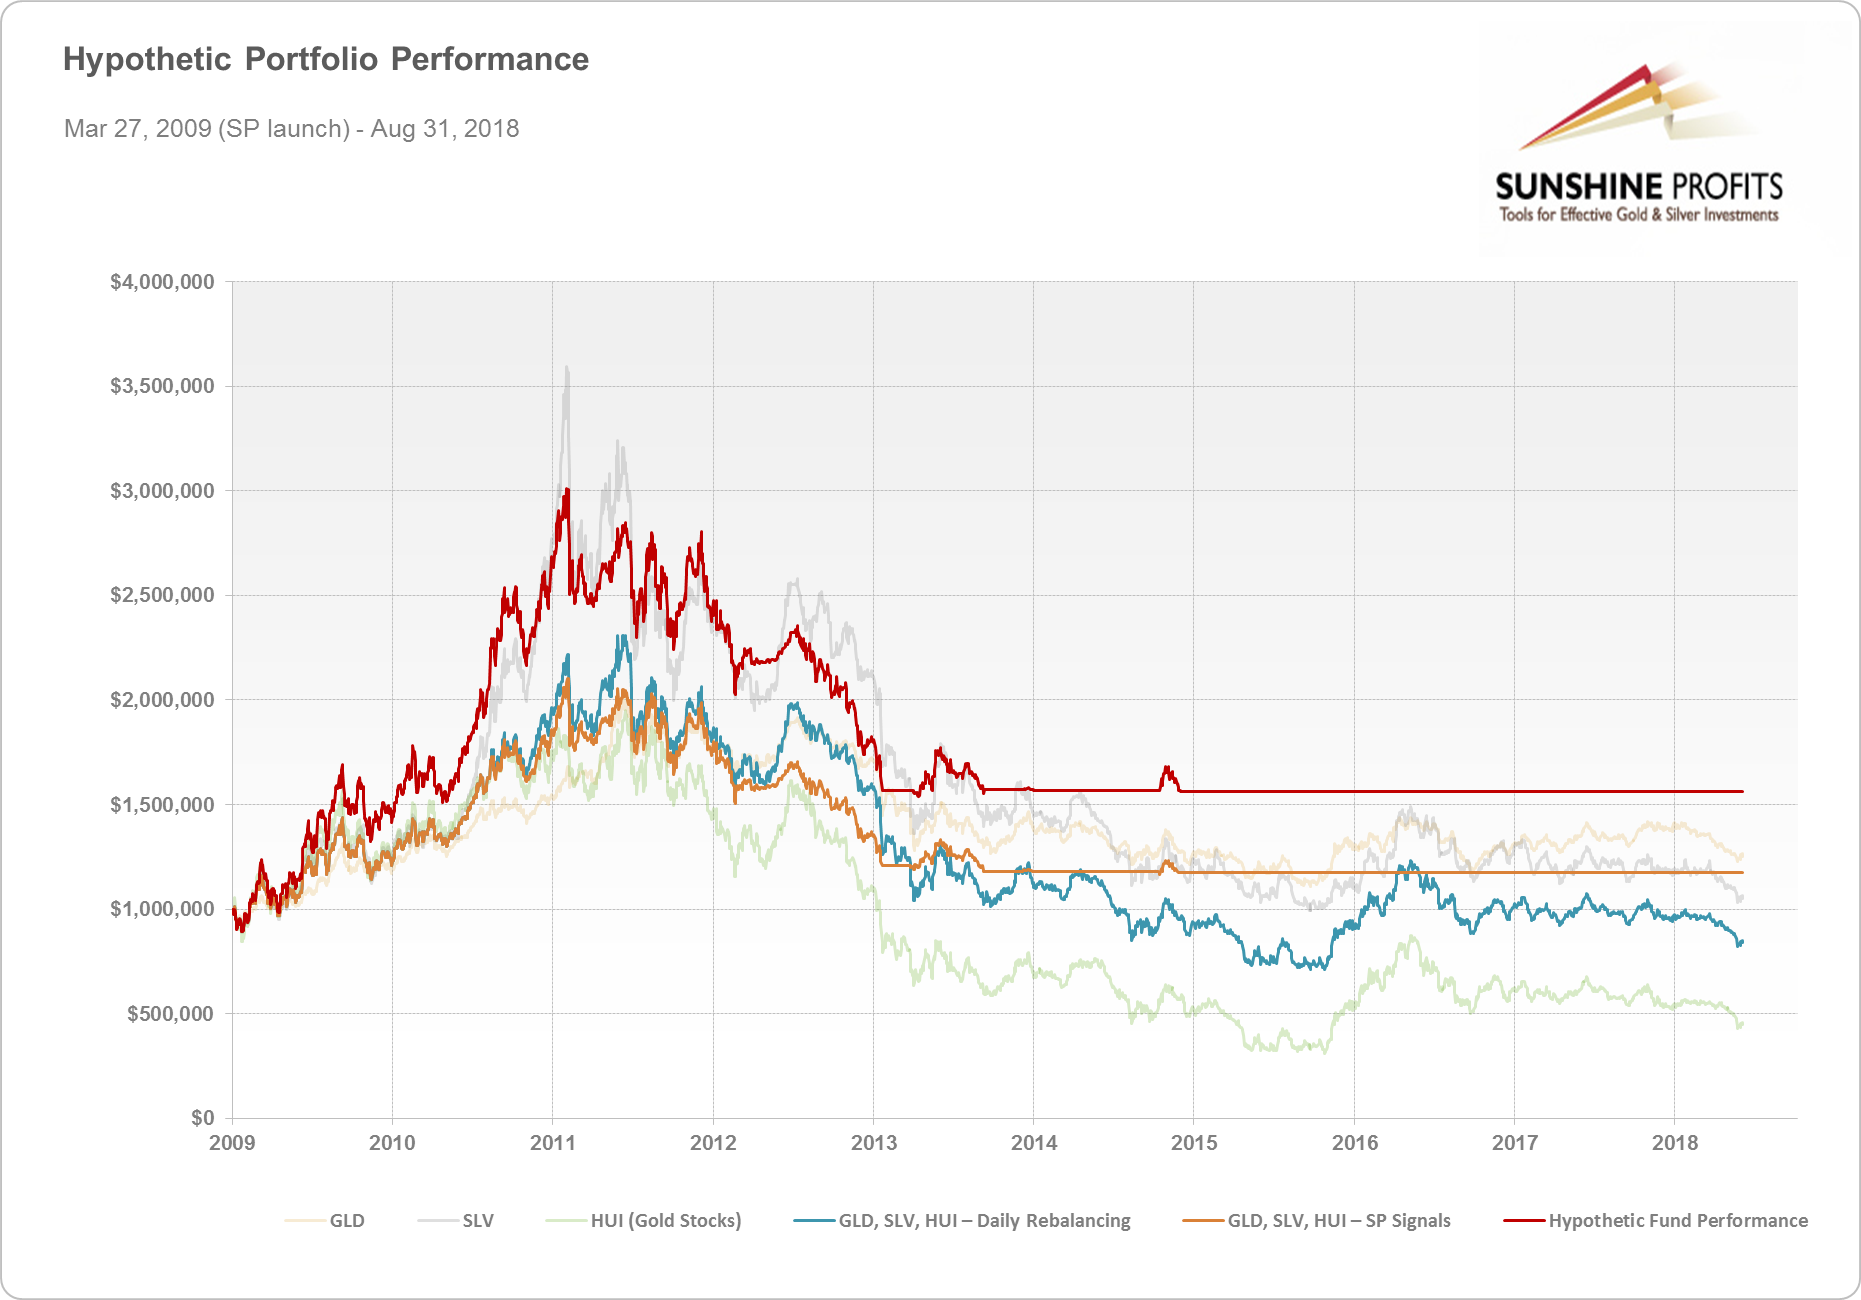
During the bull market in precious metals, our hypothetic portfolio would have visibly outperformed other approaches considered in this analysis. This is, among other things, due to the fact that our approach analyzes gold and silver miners and makes sure to include the companies that are likely to give you the biggest bang for your buck in the portfolio. This is crucial in long-term bull markets.
Let’s make this more concrete by giving you some numbers. Imagine you would have started with $1,000,000 to invest in the precious metals market. Investing in gold mining stocks alone (HUI Index) would have generated a mere $440,180 (transparent green line). Not great by any stretch of imagination. Investing in GLD, SLV and gold mining stocks (HUI) with basic daily rebalancing would have resulted in a portfolio value of $830,049 at the end of the period (blue line). That’s better but it’s still a loss. Adding signals from our analysis into the mix would have resulted in a final value of $1,172,253 (solid orange line). This is way better than the previous approaches and also a hypothetic gain. But can we do better? Incorporating knowledge about potentially favorable gold and silver mining stocks, together with a rebalancing schedule based on deviations from the target allocation of funds, we arrive at $1,563,359 as the value of the hypothetic portfolio at the end of the analyzed period (red line). It is a significant improvement over any of the former approaches. Also, it beats investing in gold (transparent gold line) or silver (transparent silver line) and leaving it be.
As you can see there’s quite a lot more to the precious metals sector than just “buying gold and forgetting about it”. There’s more than “diversifying” and more than “diversifying and rebalancing daily.” There’s even more than taking our directional signals into account.
Our hypothetical portfolio is an improvement over any other portfolio we have considered in this analysis in terms of both returns and the Sharpe ratio. In other words, historically, it would have not only realized higher returns but also given the biggest returns relative to its volatility (a.k.a. risk).
At this point, you might be thinking that the results are too good to be real, which is why we provided links to the research that backs up the mining stock selection and that shows you how much can be changed by skillfully applying rebalancing.
Yet, there is a positive bias in the above results and thus we will report it right away. The thing is that the rebalancing was done based on the optimized parameters.
“Optimized parameters” means ones that provide the best results in the dataset that we have. It’s just like customizing a car’s engine, suspension, tires and everything else in order to get the best time on a track that you can’t test before the race, but you know tracks that are similar to it. The only thing that you’d know is that the length of the track is the same as for similar ones.
You’d take your car and drive over and over again on the similar tracks fine-tuning the engine’s specifics, suspension etc. until you minimize the time on the test tracks. You’d know the average time that you got, and you’d know that you did your best to prepare yourself for the real race.
But, would it be reasonable to expect your time on the race track be as good as the best average time on the test tracks? No. But if you did your absolute best during fine-tuning, you’d know that whatever the time was going to be, it was going to be good and it shouldn’t deviate from your best times a lot. You’d also be in a good position to win this race as most other drivers wouldn’t even know about any fine-tuning processes.
Moving back to the rebalanced portfolio’s performance, we shouldn’t expect the ridiculously high performance to be repeated to the letter, but it seems reasonable to assume that the rate of return will be high.
A technique that can be helpful in checking if a given methodology really works (if its performance is not an accidental result of data mining bias) and in getting a more realistic view on the likely rate of return is called sensitivity analysis. In short, it’s a fancy name for playing around with the variables. In the case of our car race analogy, it would be checking what happens to the lap time if we change the engine’s dynamics just a little. Then we do the same with the suspension. Then with the gearbox and other parameters. And so on. If the result changes in a rather chaotic way (making the suspension harder is causing the lap time to double), it suggests that something is very wrong.
In the case of the above rebalanced portfolio, we didn’t check the engine or suspension – we checked how the final outcome depends on changing numerical parameters. For instance, when we slightly moved the percentage amount by which the portfolio has to diverge from its original value, the final outcome wasn’t affected in a critical way. The changes are gradual and rather proportional to the size of deviation from optimum. That’s exactly what we wanted to see as a confirmation that it all makes sense.
In fact, we are not using the parameters that provided the really best outcome – precisely because they appeared accidental – changing them just a bit, changed the performance in a dramatic way and the results didn’t seem stable.
Still, the rate of return is impacted by the hindsight bias since the rebalancing technique was applied to the data on which it was optimized. Consequently, there is indeed a positive bias in the outcome.
But, there are also two important negative biases – things that likely make the overall outcome worse than it should really be.
Firstly, the above dataset starts on March 27, 2009 as that’s the date when our first premium analysis of the precious metals market was published. But, that’s not the first time when we wrote anything about the PM market. Before we launched the premium version of our services, we had been publishing and sending our notifications free of charge. This took place for about a year. We sent the first message to our free mailing list on April 2, 2008. And we were bullish on the precious metals market for the long run during all that time. And in the previous years, but we can’t support that with verifiable evidence. All in all, the rebalancing-and-leverage-based portfolio’s returns would have most likely been greater.
Secondly, the above results entirely ignore the additional profits that could have been made by applying the “buy-and-hold on steroids” principles regarding periodically moving from the overvalued part of the precious metals sector to the undervalued one. Almost the entire featured period was before we created the SP Silver-Miner Indicator that’s dedicated to timing the optimal switching points, so it doesn’t seem justified to include it in the calculations. But, in our opinion, it’s likely to greatly improve our long-term performance in the following months and years.
Consequently, taking both positive and negative biases into account, it seems that, in a way, they cancel each other out. It seems to us that the overall rate of return should be even higher, but conservatively, we will not adjust the previous results.
Summing up, thanks to our research we have generated substantial value to those who are willing to act on it. One of the ways to take advantage of it is through our services: Gold & Silver Trading Alerts, and Golden and Silver StockPickers and we invite you to subscribe to them.
There is also a way in which we could utilize all of the above (not only selecting the overall exposure and individual mining stock selection, but also choosing the leverage, taking care of strategic rebalancing, and applying the principles described in the “buy and hold on steroids” essay by periodically changing weights of different parts of the precious metals sector), but we cannot disclose the details publicly, as this service is reserved for accredited investors only. If you’re an accredited investor, we invite you to contact us for details.
Thank you.
Sincerely,
Przemyslaw Radomski, CFA
Founder, Editor-in-chief, Gold & Silver Fund Manager
Gold & Silver Trading Alerts
Forex Trading Alerts
Oil Investment Updates
Oil Trading Alerts
