
Based on the March 4th, 2011 Premium Update. Visit our archives for more gold & silver articles.
Mounting social and political unrest in the Middle East boosted appeal for commodities as a safe investment option in recent weeks. Crude oil topped $100 a barrel and near month gold and silver futures traded above $1440 and $35 respectively, in the NYMEX. Besides geopolitical developments, currency fluctuations and stock markets influenced precious metals.
Ongoing interest in precious metals induces positive trend in gold and silver mining stocks. After all, gold and silver stocks move in tune with gold and silver. No wonder generally, gold mining companies business is to produce gold and sell it. As long as they dont hedge their entire production, their revenues are based on the price of gold. Higher price of gold means higher revenues, which means higher profits, which means higher stock prices. At times mining stocks lag and at times they lead the underlying metals, so analyzing them is an important addition to the regular analysis of gold and silver prices.
Lets have a detailed overview on what is happening in gold and silver mining stocks space. Without delay any longer, lets turn to this weeks technical part with gold and silver mining stocks. We will start with the long-term XAU Index chart (charts courtesy by http://stockcharts.com.)
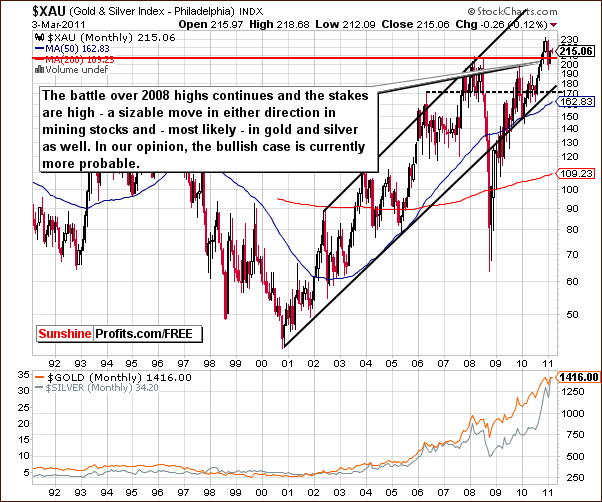
The XAU Index is a proxy for gold and silver mining stocks. Last weeks comment that This week we continue to see a fight for new highs here continues to hold for this week.
On a short-term basis, we have seen these 2008 levels surpassed, but here in the XAU Index chart, we are looking at major long-term moves. The use of monthly candlesticks, a valid charting tool for very-long term analysis, shows that values are only slightly above 2008 highs and a more significant move should be seen here before we state that such a breakout is definitely in. Therefore, we describe the trend as slightly bullish.
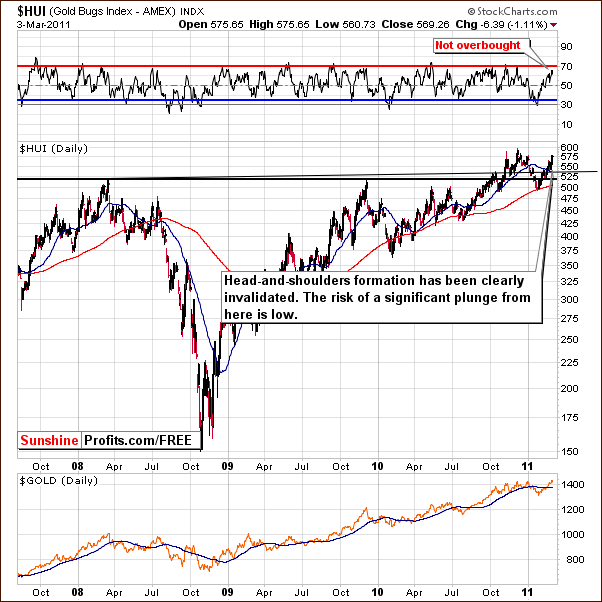
In our previous essay entitled Top in Stocks and Silver? we wrote that the head-and-shoulders pattern which was under development last week has nearly been invalidated. This would of course be a bullish development.
We now see that the head-and-shoulders pattern has been clearly invalidated with index levels remaining above the level of 2008 and 2010 highs. Consequently, the risk of a move down to the 400-450 level appears to be very low at this point. RSI levels based on the Gold Bugs Index are not above 70 and therefore not overbought. There is some room to the upside in the RSI here so a continuation of the current rally is possible and based on other factors - likely.
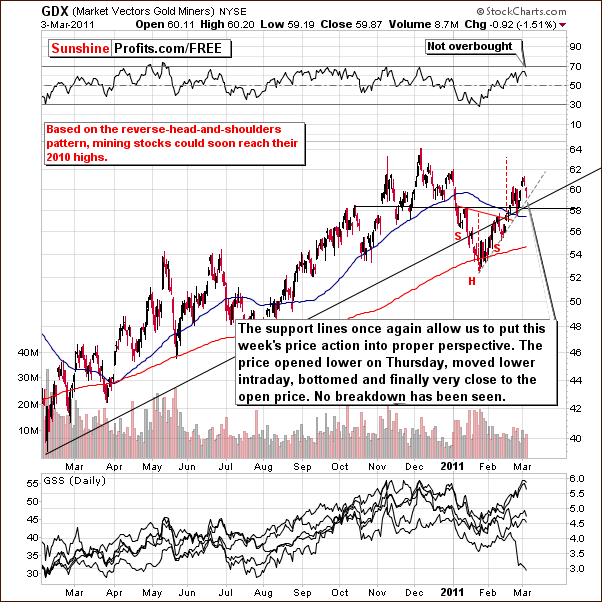
In the short-term GDX ETF chart (again, a proxy for gold & silver mining stocks), analysis of volume is our general focus point. Thursdays decline in ETF levels can be termed insignificant because it was not accompanied by an increase in volume.
As was the case with the HUI Index, the RSI for the GDX ETF is also below overbought levels. This appears to provide some support for the validity of 2010 highs as target levels although they have not yet been reached.
No support levels have been breached and index levels are closest to the short-term rising support line. This grey-dashed line in our chart has been touched on an intra-day basis but a move higher followed. The outlook remains bullish.
Now lets turn towards GDX:SPY chart.
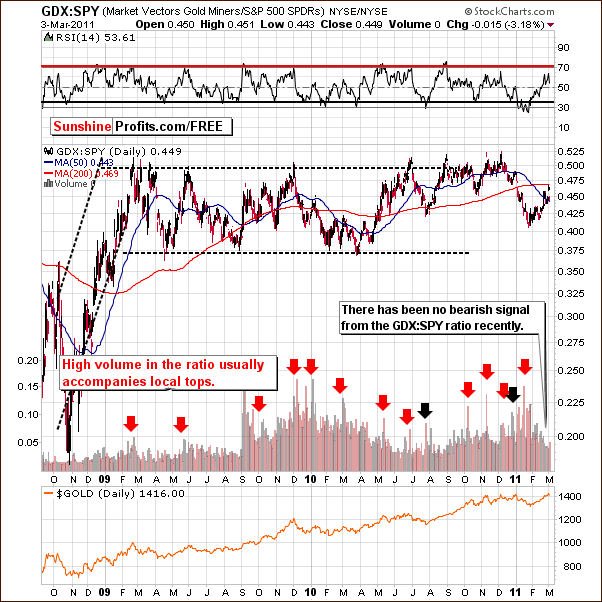
The chart provides barely any changes since the previous week, which by itself is somewhat bullish. In 25th February premium commentary, we wrote the following:
The GDX:SPY ratio chart is often used to reveal a sell signal. In other words, we usually see a spike high volume in the ration close to a local top. Such action would be attributed to the volume in mining stocks being high compared to other stocks.
We have not seen such a signal here this week and we have included this chart for this reason. Mining stock volume levels have not been high compared to volume accompanying moves in other stocks and consequently the volume ratio has not spiked.
This lack of bearish signal is additional information in favor of a rally in mining stocks although perhaps a few days pause may be seen first. The important point is that a rally is clearly more probable than a downturn based on the price and volume action seen in this chart.
Again, a single spike in volume here, especially if combined with a resistance level in the ratio and a supporting RSI would be a strong sell signal. This has not been seen recently and the critical bearish signals have not been seen lately.
Overall, gold and silver mining stocks seem ready to move higher from here. Thursdays decline was insignificant and analysis of recent trends continues to point to a bullish outlook.
The implication here is that it is possible that Thursdays decline may have been, in fact, the last local intra-day bottom rather than the beginning of a decline. Consequently, a rally could be seen from here. We will follow this closely and report to you should any of these assumptions be invalidated.
Summing up, declines in gold and silver stocks were barely visible and have not yet been confirmed. Consequently the outlook remains bullish for gold, silver and precious metals mining stocks. The question is for how long. If youve been considering using professional services to help you in your gold & silver investments, this might be a good time to go for it.
To make sure that you are notified once the new features are implemented, and get immediate access to my free thoughts on the market, including information not available publicly, we urge you to sign up for our free e-mail list. Sign up for our gold & silver mailing list today and you'll also get free, 7-day access to the Premium Sections on my website, including valuable tools and charts dedicated to serious PM Investors and Speculators. It's free and you may unsubscribe at any time.
Thank you for reading. Have a great weekend and profitable week!
P. Radomski
--
If the U.S.A. is a corporation traded on the stock exchange you wouldnt want to buy its shares, says a report from a world leading venture capital firm. The company is bloated, inefficient maxed out on debts and not productive enough. But there are ways to turn the company around.
Gold moves back and forth close to its previous tops, while silver moves higher and mining stocks are visibly below their previous highs. Is this bullish bearish and - most of all - where do precious metals go from here?! This week's update includes thorough comments regarding the current situation in the sector. Moreover, two of our indicators - SP Gold Stock Extreme indicators have just flashed a signal. Of course, the key is interpretation, and thus we provide a separated section dedicated to this phenomenon.
In other news, the dollar appears to be breaking below its long-term support line while stocks trade sideways. What are the implications for Gold & Silver Investors? What influence might the decline of the USD have on gold and silver? This is also one of the areas that we cover this week. Additionally, the latest report includes our top gold & silver junior rankings - one of our previous picks is currently 336% higher than it was in September 2010.
We encourage you to Subscribe to the Premium Service today and read the full version of this week's analysis right away.
