
This essay is based on the Premium Update posted on August 9th, 2010. Visit our archives for more gold & silver articles.
In one of our previous essays entitled The Strength of Reaction and Precious Implications we have analyzed the general stock market and the way it could influence gold, silver, and mining stocks. We have summarized that we are likely to see a short-term bounce to the upside. Now - with gold over $40 higher - we would like to provide you with a follow-up of that particular essay.
In the following part of the article we will also provide you with our thoughts related to one of the questions that we've received from our Subscribers - how is gold likely to perform in deflationary environment.
Let's begin with the long-term SPY ETF chart (charts courtesy of http://stockcharts.com) that we often use as a proxy for the general stock market.
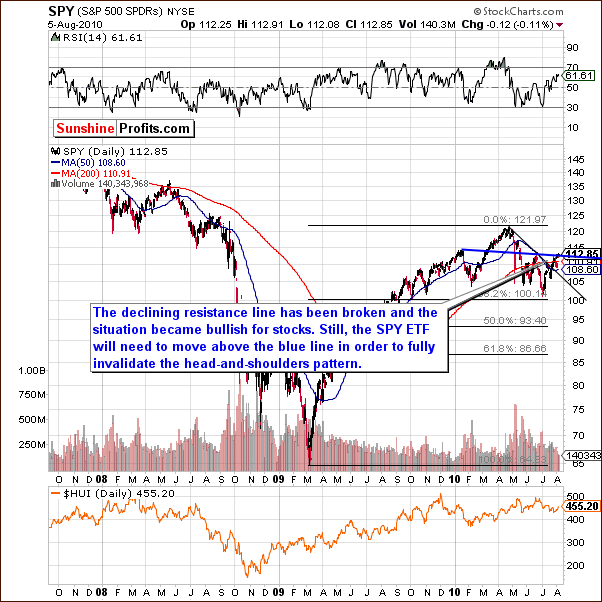
The long-term SPY ETF chart this week is not significantly different from what we presented in last week's Premium Update. We continue to monitor signs confirming that the bearish head-and-shoulders pattern has indeed been invalidated. This week's signs do not support any continuation of this pattern, but we are still awaiting a decisive move above the $113 level to put away any thoughts about this pattern. The coming week will likely provide much more insight as to short-term market direction and a final decision on the status of the bearish head-and-shoulders pattern.
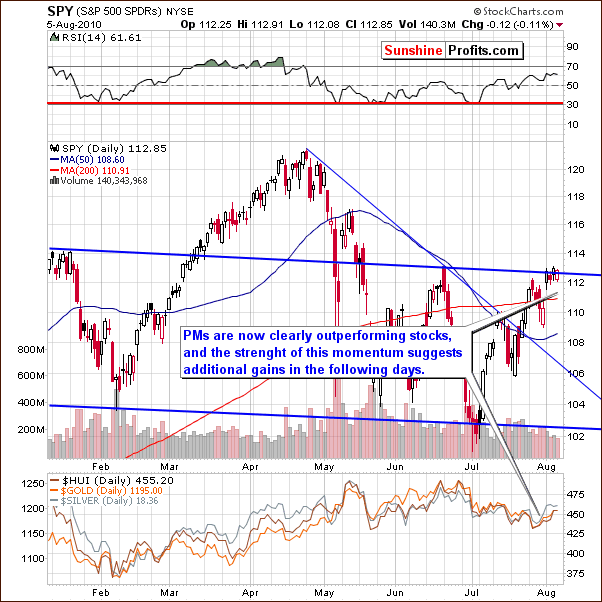
This week's short-term chart clearly shows a period of sideways movement with low volume in recent days (since the beginning of August). This short consolidation period has, however, created a small flag formation in our chart. The movement from the $112 level to $113 is the specific area where this formation is seen. The possibility exists in that the next move will again be in the range of three dollars and could take the SPY from $113 to $116.
This possible local top at the $116 level will likely be followed by a correction back to $112 or $113. Verification of this as a support level would then be tested. Note, however, that this is pure speculation and we are not advising any move be made to profit at this time - gold, silver and mining stocks provide better opportunity for this.
Precious metals are clearly outperforming stocks at present. Any show of strength by the general stock market could result in further strength for the precious metals sector. Furthermore, percentage gains for gold, silver and mining stocks may very well be greater than those in the general stock market. This is all dependent, of course, on the direction taken by the main stock indices in the coming days.
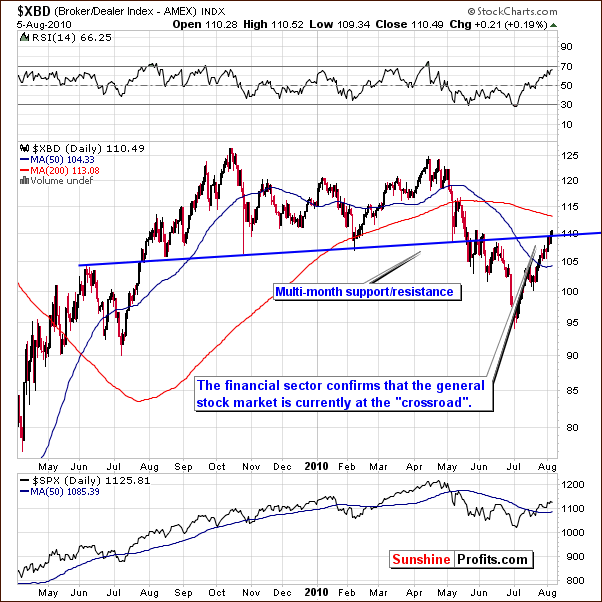
The XBD (Broker Dealer) Index checks the pulse of the financial sector. This week we see confirmation of stocks' present critical level. The multi-month support/resistance level is an obvious factor and will play a strong role in days to come. Perhaps stock values will increase dramatically for the next weeks or even months. It is possible however; that we will first see a downswing in the general stock market and this will obviously have great impact on gold, silver and mining stocks. Constant monitoring is required in these uncertain times. Sunshine Profits is ready for the task. For more details, let's take a look at our precious metals correlation matrix.
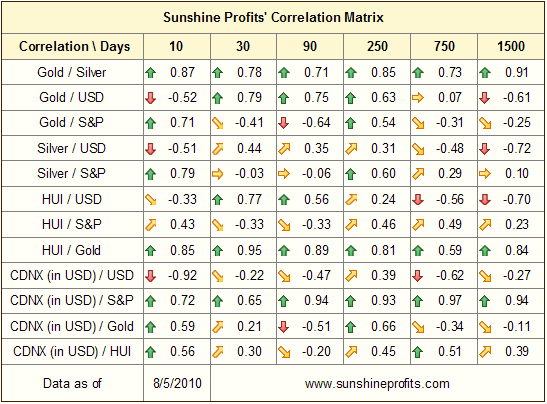
This week's correlation matrix shows only a small amount of critical information as the 10-day column to a considerable extent contradicts the 30-day one. Should this persist for several more days (meaning gold, silver and mining stocks rising along with the general stock market and against the USD Index, we could see the precious metals market top along with dollar's bottom.
Summing up, there has been a complete turnaround regarding the correlation recently between the gold, silver and mining stocks and the general stock market / USD Index. Further gains seem to be likely if the general stock market trends upward. The difficult call at this time is to project metals market trends in a period of general stock market decline. It is just too cloudy a situation to comment on at this time but, rest assured, Sunshine Profits will monitor this closely as the situation develops over the next week. Subscribers will be kept informed with a Market Alert when warranted. Our best guess here is that the way that the precious metals will respond to either breakout or breakdown on the general stock market is likely to mark the next big move in the sector.
At this point it seems that the precious metals market could become negatively correlated with the USD and then top when the dollar bottoms - just like it was many times in the past, especially prior to 2006 when gold was mainly USD-weakness-driven.
As mentioned at the beginning of this essay, we will also comment on gold's likely performance given the deflationary scenario. In fact, two of the questions that we've received in the past weeks were about gold's performance under deflationary scenario.
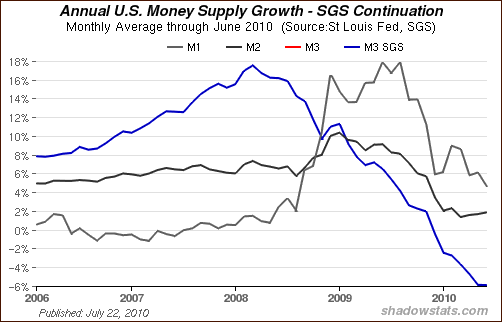
Generally, there are two opposing theories - one says that gold will fall just like every other asset during a deflation, while the second suggests that gold - being the ultimate form of cash - will thrive during a deflationary scenario. Let's begin by defining a deflation as a decrease in the general price level caused by a decrease in the money supply. The M3 money supply does indeed decline at this point.
In order to check arguments of both sides (is deflation bullish or bearish for gold) we should keep in mind the simple fact that we live in the world of fiat currencies - not backed by gold. Gold's value rose in the past during deflationary scenarios, as it was in fact cash. This is not the case right now, so this argument will not hold true under normal circumstances. However, it might become important during very serious financial turmoil periods, when the idea of fiat currency system will be widely questioned. We are far from this point in our opinion.
So, does gold go down in a big way? Not really. Given the current political environment, it seems that any deflationary scare will result in "stimulus packages", "quantitative easing" and other forms of injecting money into the economy, inevitably resulting in higher gold prices. Besides there can be other factors that could contribute to gold's rally - not only the increase in the money supply - for instance war tensions.
Of course, the negative M3 growth at this point may suggest temporarily lower prices, but that is in tune with what we've already written in this update. We don't think that it would mean the end of the current bull market in the precious metals - not until gold reaches $3000, or most likely $5-6000 or so (in today's dollars).
To make sure that you are notified once the new features are implemented, and get immediate access to my free thoughts on the market, including information not available publicly, I urge you to sign up for my free e-mail list. Sign up today and you'll also get free, 7-day access to the Premium Sections on my website, including valuable tools and charts dedicated to serious PM Investors and Speculators. It's free and you may unsubscribe at any time.
Thank you for reading. Have a great weekend and profitable week!
P. Radomski
--
In this week's Premium Update we once again provide an extensive explanation behind signals from today's Market Alert. While last trades have been completed with a significant profit, we already provide you with an early indication of what the next profitable trade may be.
We begin the report with our comments regarding the "Welcome to the Recovery" essay by Timothy F. Geithner, Secretary of the Treasury. We continue with our regular technical analysis, and end the essay with replies to several questions from our Subscribers i.a. Is money flowing out of gold and mining stocks?
We have analyzed the Euro and USD Indices, the general stock market (and the M3 money supply chart), our correlation matrix, gold (also from the non-USD perspective), silver, HUI Index, and GDX ETF charts. Additionally, we cover the Gold Miners Bullish Percent Index and our unique SP Long-Term Junior Indicator. Speaking of juniors, this week's Premium Update includes our rankings of top gold and silver juniors.
We encourage you to Subscribe to the Premium Service today and read the full version of this week's analysis right away.
