
This essay is based on the Premium Update posted December 18th, 2009. Visit our archives for more gold articles.
The recent tumble in the price of gold came as no surprise to experienced technical traders and to readers of Premium Update. We gave you a heads up to close out your speculative gold positions before the beginning of the correction. Keep in mind that even the strongest bull markets need to pause and correct before moving higher. I'm not even sure that the decline we have seen so far should be labeled a correction.
Sometimes to see the future it helps to look at the past. I like history and today I want to take one item from the history pile, shake off the dust and see what we can learn.
It is an obituary for gold that ran in the Financial Times 12 years ago. The title couldn't have been more dramatic - "Death of Gold."
I read it with astonishment pondering how in the fast-paced world, economic reality can change profoundly in a mere blink of the eye.
The article begins by saying that whereas the Three Wise Men deemed gold to be a gift fit for a king, a better gift today (meaning 12 years ago when this article was written) would be US Treasury bonds.
I can almost hear some of you laughing. Who today would prefer a U.S. Treasury bill to gold?
The article goes on to say that "a new breed of central banker is not dazzled by gold and sees little point in having an asset that just takes up storage space."
And therefore, in 1997, the year in which this article was written, the Netherlands sold 300 tons of gold, Australia had reduced its gold reserves by two-thirds and Argentina had sold its entire gold reserves, all 124 tons, and invested the proceeds in US Treasury bonds. Two years later the UK dumped most of its bullion reserves at prices below $300 an ounce.
Contrast that with today's scenario. Central Banks around the world are frantically trying to get way from their U.S. Treasury bonds and purchase gold. After India's central bank bought 200 tons of gold from the International Monetary Fund (IMF) last month, more central banks are joining the stampeded to step up their gold reserves. Just a few days after the India announcement, the Central Bank of Sri Lanka announced that it had increased its gold reserves by an undisclosed amount.
Russia's central bank has purchased 180 tons of the precious metal on the open market since June 2006 and just recently, media reports from Moscow indicated that Russia's state repository will sell 30 tons of gold to Russia's central bank. China's central bank said in April that it had built up its gold reserves by 454 tons since 2003 to 1,054 tons, making it the world's sixth largest holder of the precious metal.
Things are 180 degrees different than when the article was written 12 years ago.
The Financial Times article concludes with the following paragraph:
"When it comes to bullion as an investment, and as a measure of national wealth, gold is a goner. The reverse alchemy is almost complete. Eddie George, governor of the Bank of England, like Fort Knox, one of the great citadels of gold, recently told a European parliamentary committee: "Whereas gold used to be seen as a good asset, it is now seen as the bottom of the pile."
If you look up the definition of "sound money" the Wikipedia describes it as "a globally traded currency that can serve as a reliable and stable store of value."
It seems that twelve years after the obituary for gold was written the new definition for "sound money" should be the kind of money that makes a metallic sound when you throw it on the table - gold.
Moving on to the technical side of the market, which allows us to time tops and bottoms with decent reliability, this week I will provide you with the analysis of gold and the general stock market (charts courtesy of http://stockcharts.com).
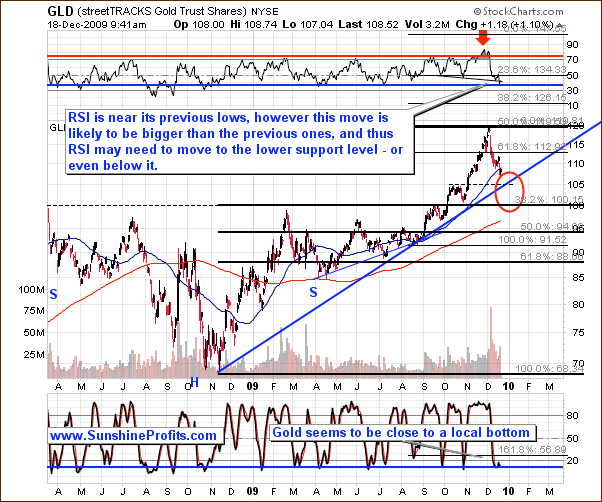
The first thing that comes to mind after looking at the above chart is that gold is still far from the 38.2% retracement level of the whole upswing. Taking a closer look results in one more support level - the $105 level in the GLD ETF. This is the price that stopped the initial post-$1,000-breakout rally, and it currently corresponds also to the medium term support line. This may stop the decline for a while (and both indicators on the above chart: RSI and Stochastic confirm this), but will it be able to form a major bottom there? It depends to a large extent on the situation on other markets, but - as mentioned last week - it currently doesn't appear to be the likely outcome.
The analysis of the short-term situation provides additional confirmations.
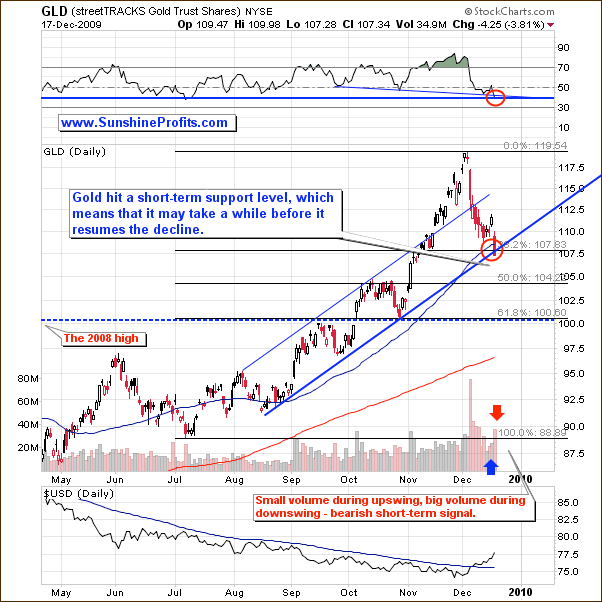
The price levels that were mentioned in the above part of this update are almost perfectly corresponding to the Fibonacci retracement levels on the short-term chart. The first (38.2%) level retracement level was just achieved, and the two following ones (50%, 61.8%) more or less correspond to the above mentioned $105 and $100 level.
This means that reaching any of them may cause the price to reverse, but it doesn't seem that it will be the first level that stops the plunge. Once of the reason that I'm skeptical about an immediate turnaround is the situation in volume. Please note that the volume was low on Wednesday, when price of gold moved higher, and it was high yesterday, when gold declined. This is not a positive signal, and it suggests that the decline is not over yet. It is currently difficult to say if it will be $105 or $100 that would stop this plunge, but this should become clearer once we move closer to these levels - should anything change significantly I will send out a Market Alert to my Subscribers.
The general stock market is one of the key drivers behind the prices of PMs, so it is always usefully to analyze it.
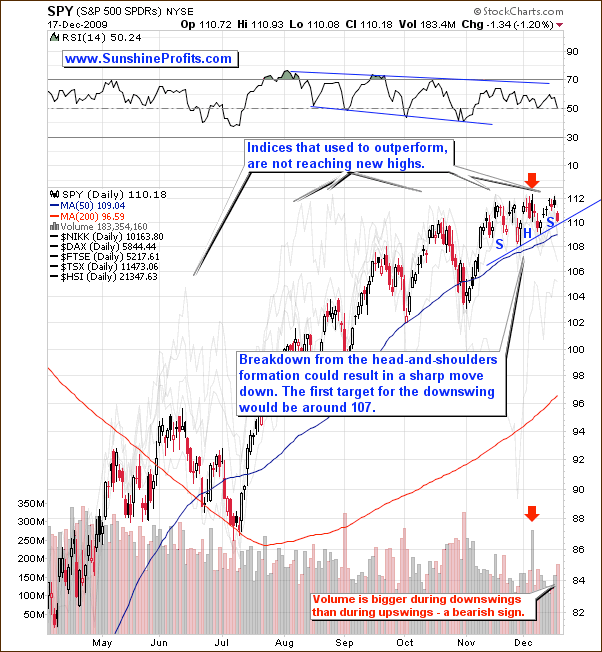
The previous bearish situation in the main stock indices did not change this week. We've seen the general stock market rally once again, but the upswing has once again failed to move above the previous highs, which is another bearish signal. Moreover, this created a head-and-shoulders pattern, which means that once we move below $110 in the SPY ETF, the following decline is likely to stop no sooner than at $107.
The bearish implications of this chart are strengthened by the corresponding action in volume - which is higher during downswings than during upswings.
Additional conformation comes from the analysis of the financial sector.
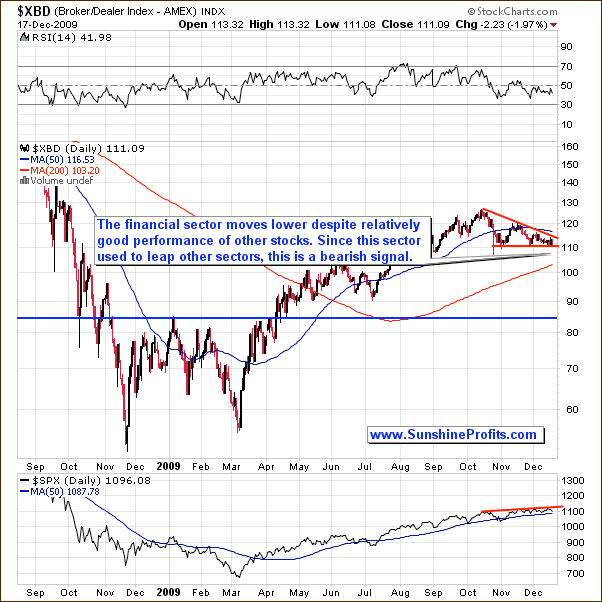
The situation on the Broker / Dealer Index creates a bearish divergence with the general stock market. The financial sector used to lead the whole market in the past, so the fact that each new top is lower than the previous one, signals that the whole market may plunge sooner rather than later. This is a negative factor for the PM market, because precious metals are still positively correlated with main stock indices. However, this may change in the future, and such change may mark the end of the current correction in PMs. The other important market that influences the prices of gold, silver and corresponding equities, is the USD Index, and this is one of the things covered in the full version of this commentary.
Summing up, although gold is quite popular topic in the media these days, vast majority of investors is still out of the market. They talk about it - become increasingly more interested in the PM sector - but they are not convinced enough to buy silver and gold. This is why there is still much room to go for this bull market, and for you to multiply profits that you have achieved so far (based on this decline only and today's closing price - my Subscribers saved 11% (no leverage) of the invested capital on selling GDX near the top).
From the short-term perspective, however, it seems that the correction is not over yet, and that its second part has just begun. This outcome has been indicated by several markets, so its reliability is rather high. Additional details including targets for USD Index, SLV and GDX are available in the full version of this essay, along with 18 detailed charts with implications on your portfolio.
To make sure that you are notified once the new features (like the newly introduced Free Charts section) are implemented, and get immediate access to my free thoughts on the market, including information not available publicly, I urge you to sign up for my free e-mail list. Sign up today and you'll also get free, 7-day access to the Premium Sections on my website, including valuable tools and charts dedicated to serious PM Investors and Speculators. It's free and you may unsubscribe at any time.
Thank you for reading. Have a great weekend and a profitable week!
P. Radomski
--
This week's update is mostly about gold - it includes 9 gold charts. Although gold is quite popular topic in the media these days, vast majority of investors is still out of the market. They talk about it - become increasingly more interested in the PM sector - but they are not convinced enough to buy silver and gold. This is why there is still much room to go for this bull market, and for you to multiply profits that you have achieved so far. From the short-term perspective, however, it seems that the correction is not over yet, and that its second part has just begun, and in this week's Premium Update we speculate on where the bottom is likely to be put.
Additional things covered this week include: USD Index, main stock indices, and the financial sector. Apart from covering the current situation on the precious metals market, I analyze the performance of gold in various currencies: Euro, Yen, British Pound, Canadian Dollar, and Australian Dollar.
We encourage you to Subscribe to the Premium Service today and read the full version of this week's analysis right away.
