

We were recently asked if the price of gold is likely to rally because of the increased volatility in stocks. This seems believable at the first sight, as gold is seen as a safe-haven asset and thus people could be buying it when the stock market’s movement becomes chaotic, scary and/or unpredictable.
So, the stock market’s volatile decline in the recent days is likely to become the catalyst for gold’s breakout above the $1,350 - $1,400 trading range, right?
Wrong.
That’s simply not how things work. The above scenario sounds believable, but it’s not how gold responds to increased volatility and the above chart proves it.
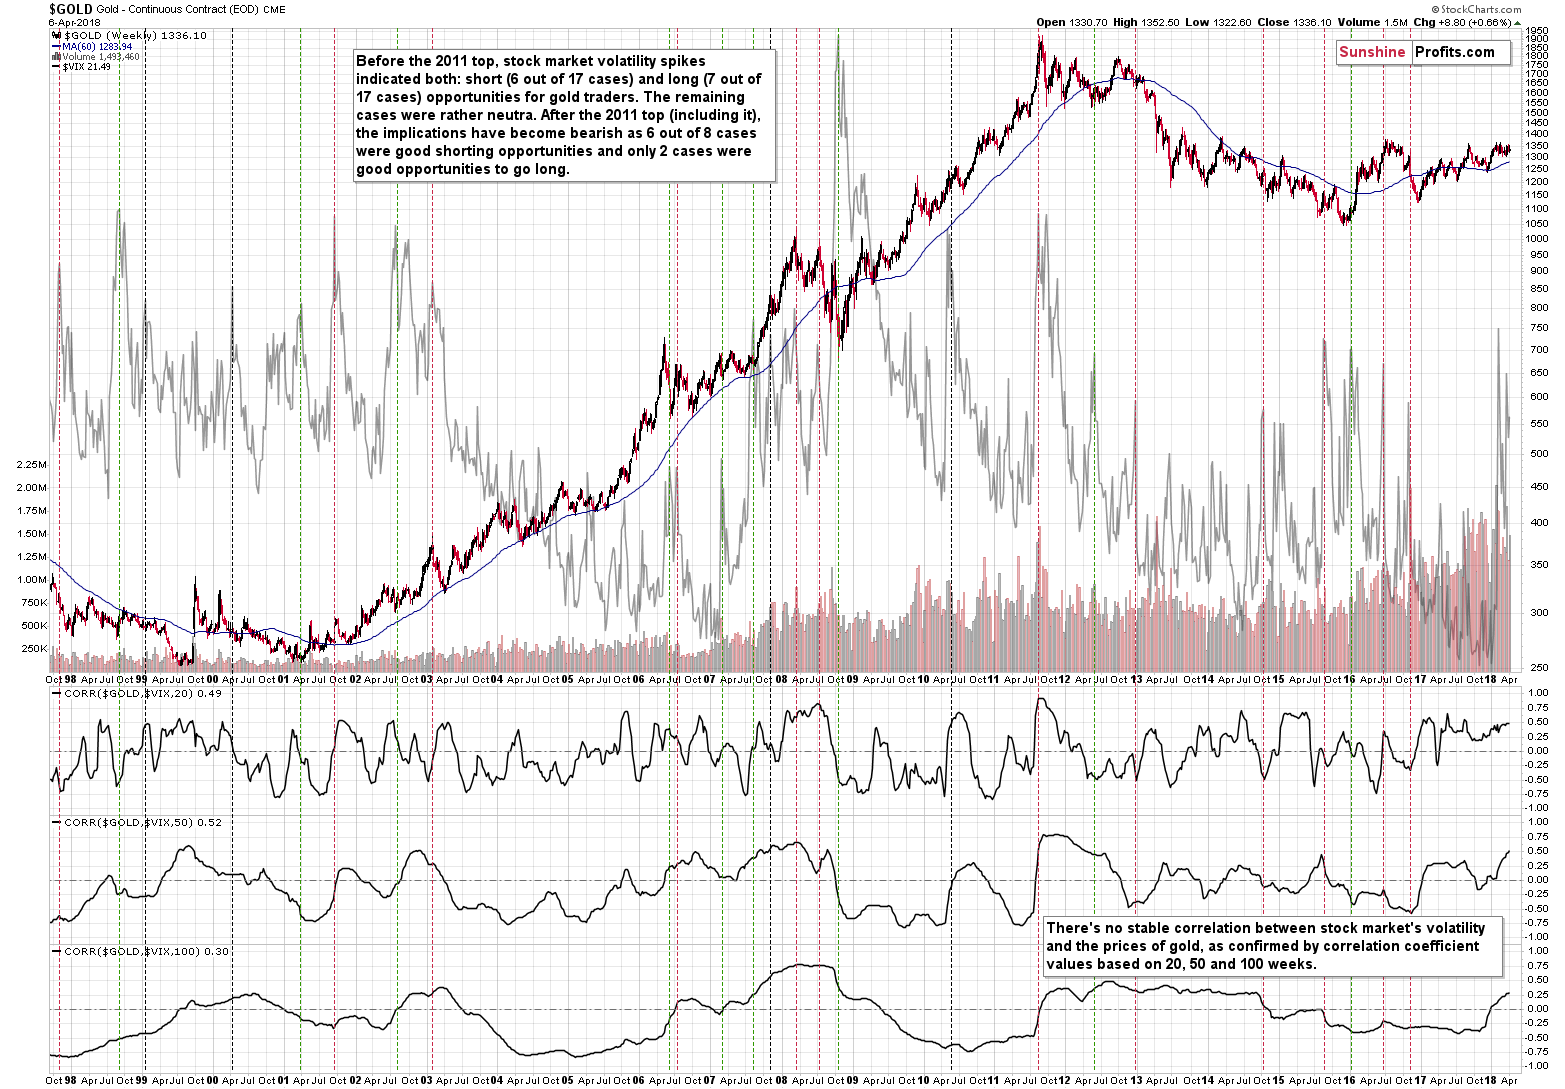
Let’s start with the lower part of the above chart that features both gold and the VIX index, which we use as a proxy for the stock market’s volatility. If gold was to reflect the stocks’ volatility, it should be taking place more or less all the time – or at least for the significant majority of time. That clearly wasn’t the case and the correlation coefficients reflect that.
We checked the relationship between gold and the VIX in terms of correlation in three versions: based on the 20 weeks of data, based on 50 weeks and based on 100 weeks. The value of the correlation coefficient moves back and forth around 0 in all cases (and in all other cases that we checked but that we don’t feature on the above chart to preserve its readability). This means that there is no stable correlation between the two. This alone is something that should make you think that it’s not safe to base the bullish outlook on stocks’ volatility.
But wait, there’s more.
Putting correlations aside, let’s see what happened when the volatility spiked, just like what we saw recently. Maybe the relationship is not present at all times, but it’s there during critical times.
Wrong again. This time a bit less, because there is a mildly strong tendency for gold to reverse its course during the VIX’s spikes. It doesn’t mean that gold always bottoms at that time, though. Remember the 2011 top in gold? It was accompanied by a spike in the VIX – the measure that’s supposed to indicate breakouts and trigger further rallies.
We marked the noteworthy spikes in the VIX with vertical lines on the above chart. Before the 2011 top, there was a similar number of cases that were good opportunities to go long (7 out of 17 cases) as there were good opportunities to go short (6 out of 17 cases). It’s not clear which positions would be better in the remaining cases (too much depends on one’s individual approach). In other words, a spike in the volatility of stocks usually suggested that some kind of move was about to be seen, but it didn’t indicate what kind of move that would be. Consequently, it was not a useful sign for detecting good moments to go long or short – at least not on its own.
Since 2011 things have changed as 75% of cases (6 out of 8) were good shorting opportunities. The remaining 2 cases were good opportunities to go long. So, on average, it seems that as far as the current stage of the gold market is concerned, spikes in the VIX should be viewed a sell signs for gold rather than buy signs.
Naturally, the above is not strong enough on its own to make the outlook bearish, but it’s a useful confirmation technique that can supplement other, more reliable, signals.
During the most recent spike in the VIX, gold was just after a short-term upswing and the rally stopped shortly. It seems like it is yet another time, when the increased volatility in the stock market confirms that we currently have a great shorting opportunity.
Summing up, increased volatility in the stock market is not a reason for one to expect a rally and a breakout in gold. Conversely, the spikes in the VIX have been mostly good shorting opportunities since 2011 and based on what has already happened in gold, it seems that the recent volatility increase is a bearish sign for the precious metals market.
Naturally, the above is up-to-date at the moment of publishing it and the situation may – and is likely to – change in the future. If you’d like to receive follow-ups to the above analysis (including the intraday ones, when things get hot), we invite you to subscribe to our Gold & Silver Trading Alerts.
Thank you.
Sincerely,
Przemyslaw Radomski, CFA
Founder, Editor-in-chief, Gold & Silver Fund Manager
Gold & Silver Trading Alerts
Forex Trading Alerts
Oil Investment Updates
Oil Trading Alerts
