This essay is based on the Premium Update posted December 30th, 2009. Visit our archives for more gold articles.
The precious metals moved higher in the first trading session of 2010, which is traditionally known as a bullish sign for the whole following year. However, this single session does not determine the direction in which metals will head in the following days / weeks - there are other tools that need to be applied in order to find the most probable short-term outcome. In the following essay I will focus on the current situation on the gold market (charts courtesy of http://stockcharts.com) and its implications for long-term Investors and short-term Speculators.

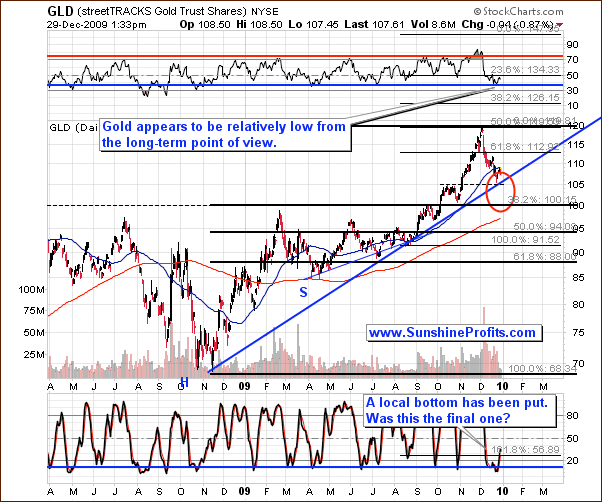
Over a week ago we wrote that the price of gold (GLD ETF) is very close to the long-term support level (rising thick blue line) - the aforementioned $105 level. It is also currently in the area marked with red ellipse, which suggests that the bottom may be very close.
Consequently, we have just seen a local bottom in the gold market, but the question remains if that was the final bottom for this decline, and gold will move higher in the following weeks, or was that just a small pause within the decline.
The Stochastic indicator (on the bottom of the above chart) has put a double bottom, which in the past meant that a local bottom is in. The Relative Strength Index (on the top of the above chart) confirms that gold is moved close to the "oversold" territory, and might have just put a local bottom.
Therefore, the key question is - should I go back on the long side of the market?
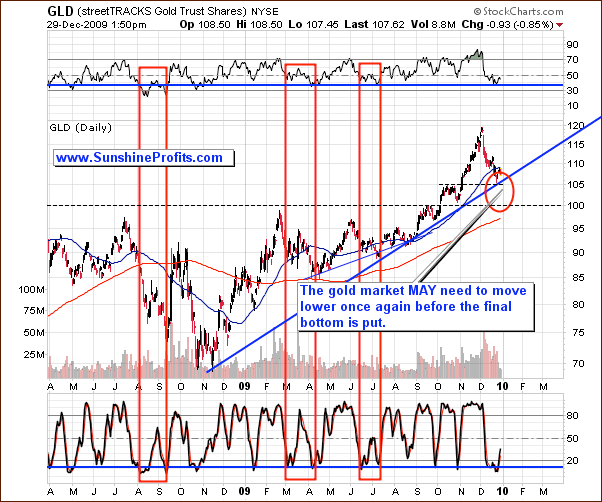
If you've been following my analysis for some time, you might have noticed that I'm usually very careful when it comes to saying that "this or that will take place". There is a very good reason for that, which is connected with my overall approach toward investing. Before elaborating on that topic, I would like to provide additional version of the above chart. Normally we would have put everything on one long-term chart, but this time it seems that it would make the whole analysis rather unclear.

The reason that we decided to feature the second version of the same chart is that it emphasizes the similarity between several situations (red rectangles) that can be extrapolated to what we see today.
Please note that each of the marked time frames begins with a decline after a significant top has been formed. This corresponded to a relatively low value of the RSI indicator and a double bottom (or a big single bottom) in the Stochastic indicator. This is exactly what we see today. It was three times in almost 2 previous years when the initial "Stochastic double bottom" and low values of RSI after a decline meant that only the initial part of the downswing has been completed.
Back then the decline took the form of a "zigzag", meaning that there was one small rally within the decline, that caused the Stochastic indicator to move above 50. Applying this tendency to today's situation on the gold market suggests that gold may rally insignificantly only to move lower once again. Should that take place, we will need to look for some kind of confirmation - most likely in the form of either high (that was an important bottom) or - more likely - low volume meaning that gold is likely to move lower in the short run.
At this point I would like to get back to the topic that I've started a few paragraphs earlier regarding the overall approach toward investing.
The reason that I rarely tell you what "will" happen is that there is nothing certain in the future, especially when the capital markets are involved. The commodities market tends to be very volatile, so it is even less predictable than prices of other assets. Yet, there are many techniques and tools (and I'm on a never ending search for the most reliable ones) that allow us to analyze the market and provide us with an insight as far as the chances that a particular move will materialize are concerned. I have put the "chances" word in bold, because that is the key word here. The chance that a bottom / top / breakdown, or breakout will materialize is all we can infer from the analysis of charts, or by using other means.
Investors often ask me "is the bottom already in?" or "was this the breakout?". I read it in the following way "should I buy?" The problem is that in 99% cases I don't know anything about the person asking this question, nor about their investment preferences. Without that, it's impossible to answer this question. One might ask "Why? That's a relatively simple question..." The question (just like investing itself) is simple, but not easy.
The "was the bottom in?" is just a small part of a much bigger question - "how should I position myself given the current market conditions"
Long-term Investors generally want to keep their holdings invested in a given asset class until the final top is reached (hundreds or much more likely thousands of dollars away). However, given the fact that gold and silver may plunge fast (the big 2008 downswing), these Investors would also prefer to stay out of the market with at least a part of their holdings during the most unfavorable conditions. Consequently, they want to stay out of the market only when the risk of a sell-off is very big, and ride out the smaller / less probable declines. For long-term Investors, the risk is to be out of the market, because the consequences of being totally out of the market are too important - missing a $200 move to save $10 on an entry point simply isn't worth it.
This means getting back to the long side of the market as soon as the risk of a deep decline is low.
This is the case today. By buying now, one is not buying at the top - more than $100 below it in gold. Moreover, the "bottom area" has been reached, so the risk of a deep decline from here is limited. Consequently, it makes sense for long-term Investors to enter the market, even though there are no "clear" signals that the bottom is in. In other words "it is profitable enough" for one to get back on the long side of the market with their long-term capital, to do it.
Speculation is a different matter. Here, you take small positions, trade often, and a wrong decision every now and then is to be expected (!). Therefore, Speculators usually want to stay with their capital on the sidelines and enter only during the most favorable conditions. This approach allows them to minimize the number of losing transactions and maximize the amount of the profitable ones. Consequently, being out of the market is not a big risk as far as the speculation is concerned. Here you can say that "there's always the next train." You can - and it is profitable to - wait for the most profitable risk/reward situation and enter the market at this particular moment.
This means waiting for the most appealing risk/reward combinations. Naturally, you may - and most likely do - have a different style of trading than the one mentioned above, and that is perfectly fine with me. Still, the main implication remains - trading is about many single transactions and maximizing the odds of a success in each of them. More details about portfolio structuring are available to Subscribers along with meticulous analysis, premium charts and tools.
Summing up, although situation seems favorable from the long-term point of view, there are several factors suggesting that this may not have been the final bottom for this decline. Therefore, speculators might want to wait for additional signals before opening a position here.
To make sure that you are notified once the new features (like the newly introduced Free Charts section) are implemented, and get immediate access to my free thoughts on the market, including information not available publicly, I urge you to sign up for my free e-mail list. Sign up today and you'll also get free, 7-day access to the Premium Sections on my website, including valuable tools and charts dedicated to serious PM Investors and Speculators. It's free and you may unsubscribe at any time.
Thank you for reading. Have a great and profitable week!
P. Radomski
--
This week's Premium Update is one of the biggest that we've created so far - 14 charts and over 5000 words dedicated to the precious metals market and everything around it with the focus on the long-term success of your portfolio. We analyze gold, silver, and PM stocks from both long- and short-term perspective. In fact, the analysis of the long-term gold chart had to be split into two separate charts because of the amount of the information that they contain. Other things covered in this Premium Update include: the change in the correlations between PMs and one of their key drivers, PM stocks' relative performance to other stocks, analysis of the financial sector, one of our unique indicators, the cyclical tendencies on the following markets: silver, PM stocks, USD Index - and much more.
Additionally, I summarize the performance of the Premium Service in 2009, which I'm sure you will agree has achieved a high degree of accuracy. Below you will find a few examples of the points that were made in the past:
- December 2008 - we urged our Readers to enter long-term trades in gold. (It started at $870 and went up to a high of $1,224 a year later.)
- February 18th - we warned short-term Speculators of an upcoming decline. (The price of gold went down six days later by $100.)
- April 20th - we encouraged our Subscribers to add to their gold position. (That day gold began a month and a half rally from $902 to $981.)
- November 3rd - we warned our Subscribers that the real risk is to be out of the precious metals market.(That day gold closed at $1,084 and didnt look back until it climbed to its peak, $1,224 a month later.)
Moreover, after its parabolic rise, we provided our Subscribers with full six-day warning ahead of time to close out their positions before the price of gold began its decline. On November 27th we sent out the following:
If you are still long gold/silver/PM stocks with your speculative capital it may make sense to exit your positions now.
That day gold closed at $1,172, went up for another four trading days to hit a high of $1,224, and began its decline since December 3rd.
We encourage you to Subscribe to the Premium Service today and read the full version of this week's analysis right away.

