
Gold & Silver Trading Alert originally sent to subscribers on November 3, 2014, 6:50 AM.
Briefly: In our opinion speculative short positions (full) in gold, silver and mining stocks are justified from the risk/reward perspective. We are adjusting the stop-loss levels (again), so in a way we are locking-in even more of the profits from the current positions and, at the same time, keeping a chance of increasing them.
Gold, silver and mining stocks plunged heavily last week. We saw major events such as breakdowns and we saw some key levels being reached. The miners’ slide and the silver’s and gold’s breakdowns were widely commented, but there are additional developments in the ratios that investors and traders need to consider at the moment.
Before moving to the ratios, let’s start with the U.S. dollar (charts courtesy of http://stockcharts.com).
In the previous alert we wrote the following:
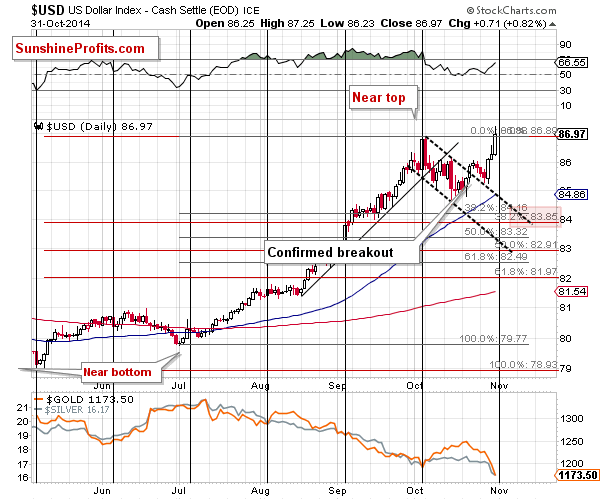
What’s next? The cyclical turning point is at hand, so we might not see many more daily upswings in the near future. The closest resistance is at the previous October high, about an index point above Wednesday’s close. Consequently, we are quite likely to see another sharp upswing, but it also seems likely that the USD Index will at least pause after reaching its previous high, at or close to the turning point.
We indeed saw a sharp upswing in the USD Index yesterday and also in today’s pre-market trading. Today, the USD Index moved to 86.74, which is very close to its early-October high of 86.87. We could see a pause or another decline from here, especially that the cyclical turning point is at hand. The situation in the currency market is very interesting at this time (especially in the USD/JPY pair) but that’s something that we will discuss in today’s Forex Trading Alert.
The USD Index moved even higher – to 87.25, but closed only slightly above the previously-broken level. It’s still quite likely to decline given the unconfirmed status of the breakout and the cyclical turning point. Consequently, the above remains up-to-date.
Let’s move to metals. Has the outlook become bullish for the precious metals sector based on the above? Just as we wrote in Friday’s alert – not necessarily.
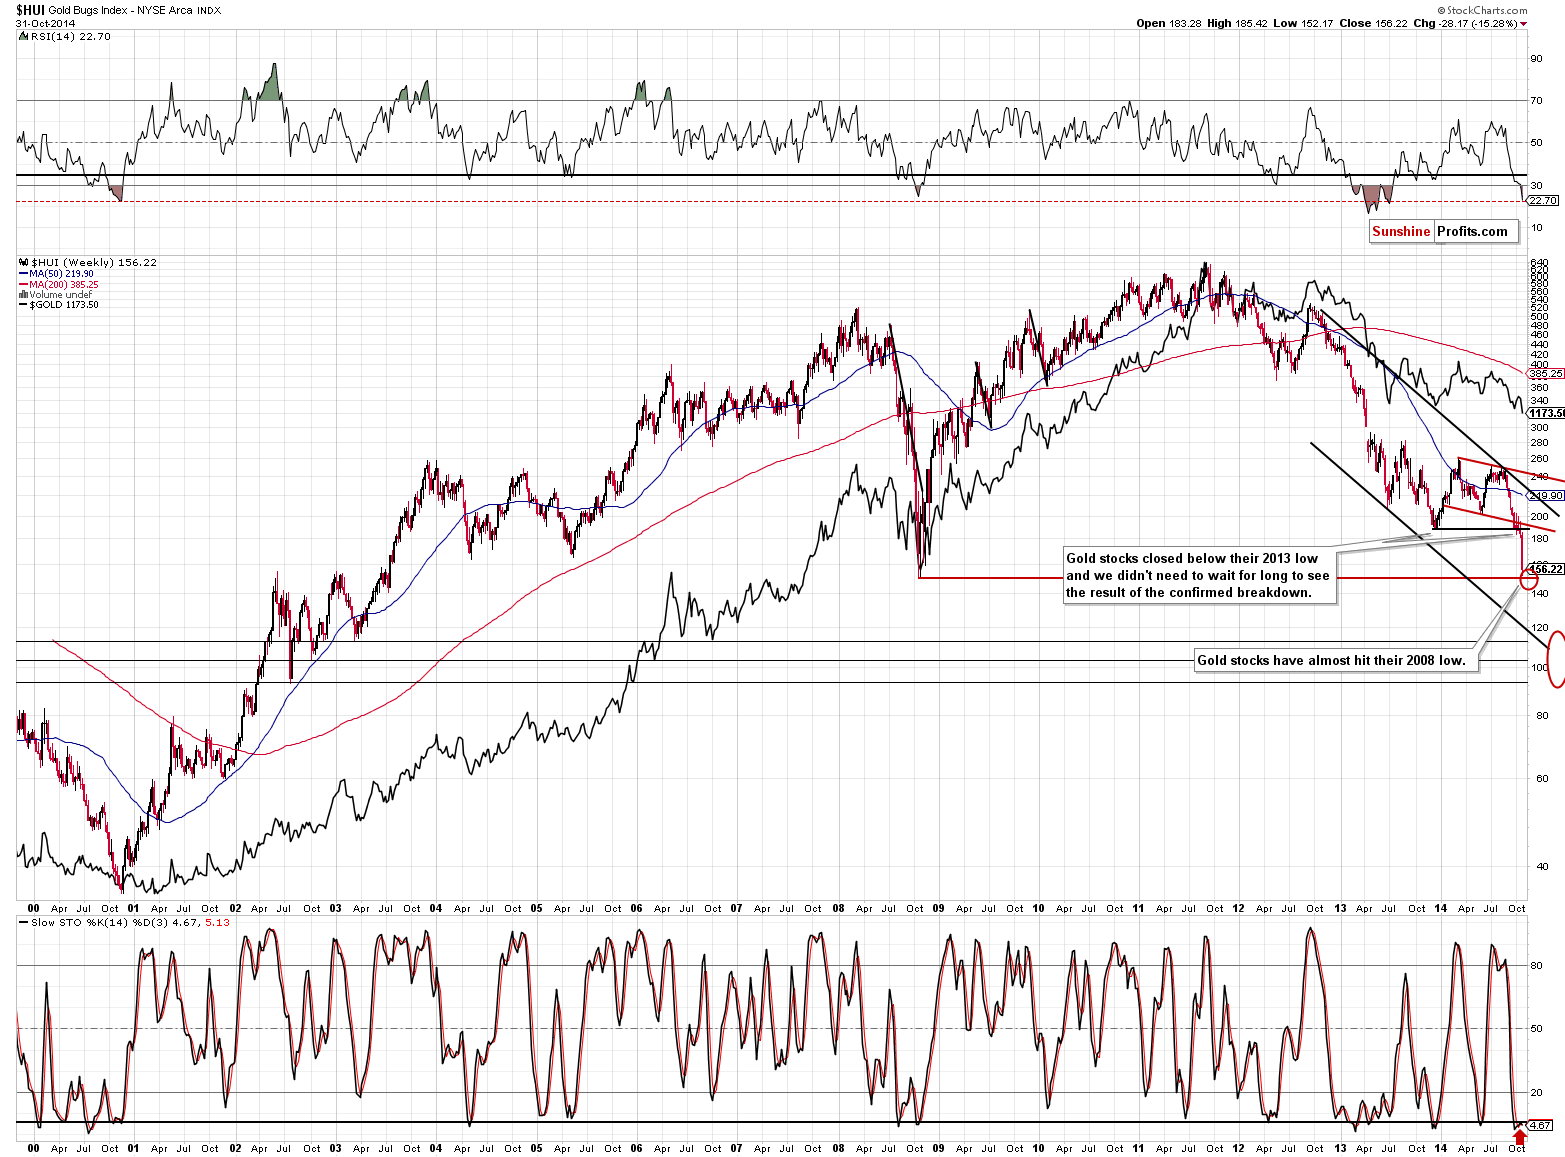
On Friday, we wrote the following about the above chart:
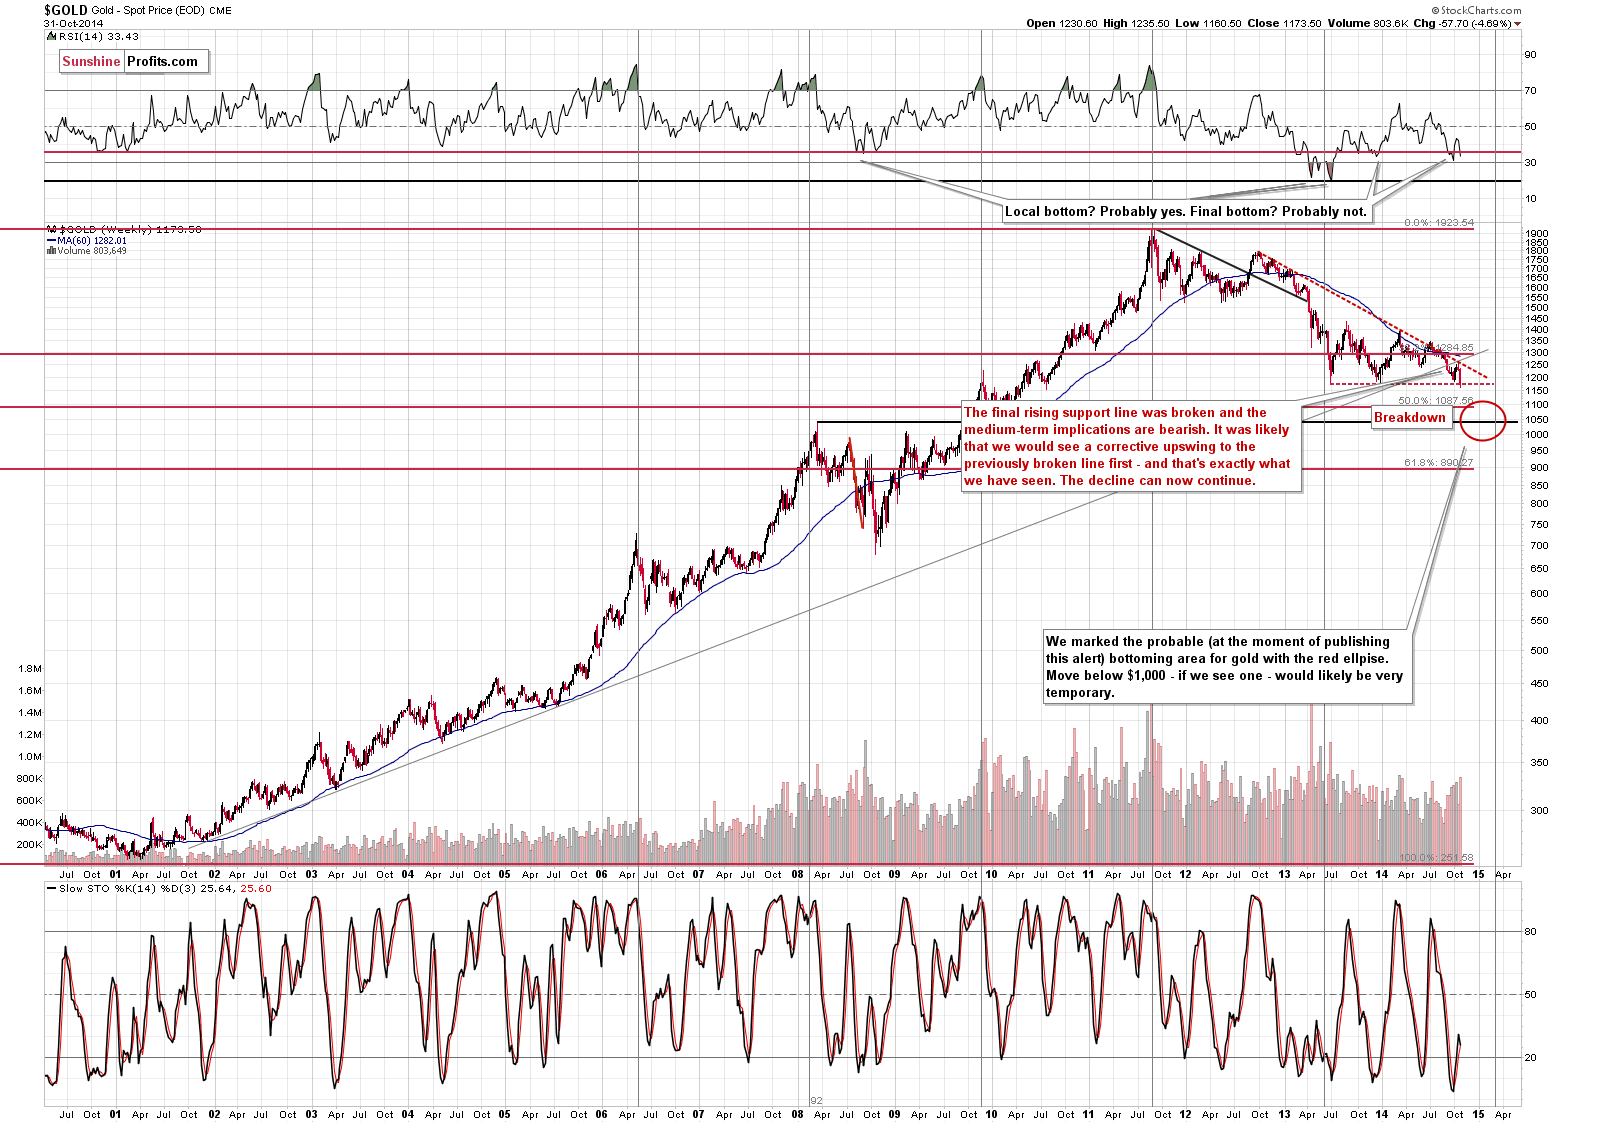
From the long-term perspective we see that this month’s rally was in fact a corrective upswing that took gold to combination of strong resistance lines. It was a breather that we expected to see and as it’s already been seen, so we can now expect the decline to continue. Perhaps the next big slide is already underway.
The big slide is already underway and profits from the short positions have become even bigger. However, could they grow even further before the decline is over? Yes, and the reason for that is that in today’s pre-market trading gold moved below the 2013 low of $1,179.40. The breakdown is not confirmed at this time, but this price level is so visible and profound, and closely-watched that perhaps even an unconfirmed breakdown could trigger further selling, and thus declines. At the moment of writing these words gold is at $1,164 after moving to $1,161 and correcting a bit. There has been no invalidation of the breakdown.
It turned out that gold closed the day and the week below the 2013 intra-day low. The move is not clearly confirmed, but more confirmed than it was before the session started and when we sent the previous alert.
Consequently, the situation is still tense, but the close below the previous lows suggests that the next move will be to the downside. It will be much more certain if we see 2 more consecutive closes below this level.
Please note that the RSI indicator is not at a level that would suggest a major bottom.
Moving on to the silver market, let’s start by quoting yesterday’s alert:
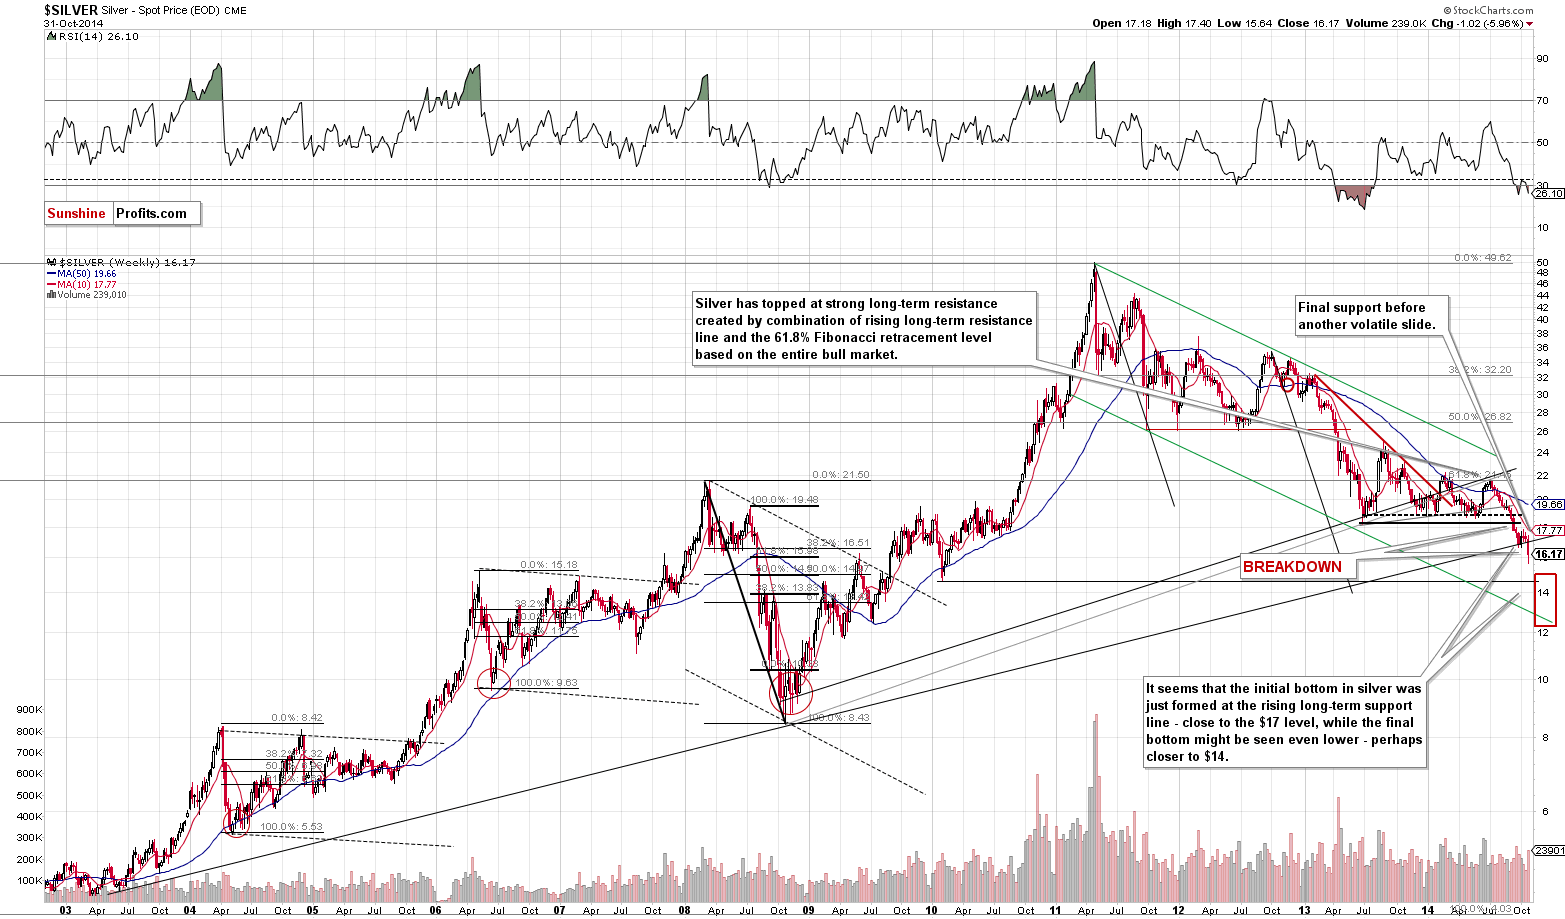
When silver finally gives in and breaks this level [the rising long-term support line], it’s likely to catch up with gold and miners and decline sharply. Please note that once this support is taken out there will be no other support to stop the decline until the white metal moves below $15.
Is silver still a great investment when one takes a few years into account? We think so.
Can silver plunge very low before it starts another powerful rally regardless of its favorable fundamental situation? Yes, it can.
Silver broke below the rising support line and it indeed quickly caught up with gold and miners by declining sharply. Silver closed at $16.17, well below the support. The next strong support is below $15 so we could a see a big slide even without additional bearish triggers (such as a rally in the USD Index).
As you know, miners plunged significantly as well.
Both indices: HUI and XAU moved sharply lower last week. In Friday’s alert we wrote the following:
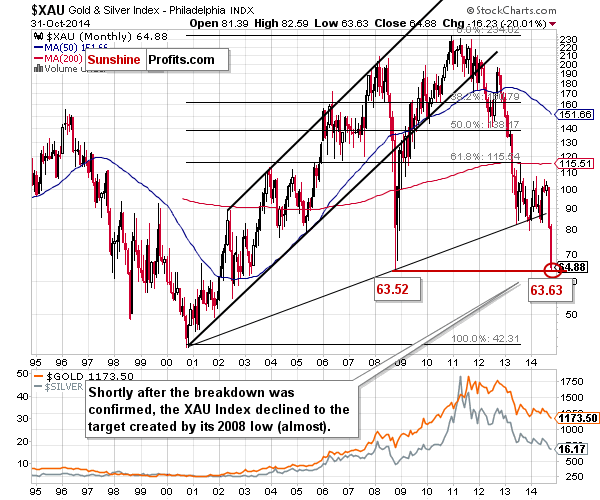
If they repeat yesterday’s decline, they will reach our initial target levels. Just a few weeks ago some would call 150 in the HUI Index “unthinkable.” It will quite likely be a reality today or in the next few days. The miners’ recent performance suggests further declines especially that there were no big declines in the general stock market.
There is no significant support that could stop the decline before the 2008 lows, so it’s likely that these levels will be reached. Moreover, gold stocks and silver stocks could move even lower without a bigger correction (that’s a bit unclear at this time, though).
The “unthinkable” move to the 2008 lows has indeed become reality. Both important indices moved very close to these lows – close enough to say that they were more or less reached. The key question is – is the bottom in? Our initial target has already been reached, so we could see an upswing, but given gold’s breakdown, we could also see a very sharp downswing. Consequently, exiting short positions here might be premature.
All in all, we have a visible breakdown in silver (declines are likely), small breakdown in gold (declines are likely, but the situation is not as bad as it is in the case of silver) and a move to the initial target in the case of mining stocks (rather bullish implications). Overall, the situation is not crystal clear at this time if we take a look at metals and miners only.
Let’s take a look at ratios.
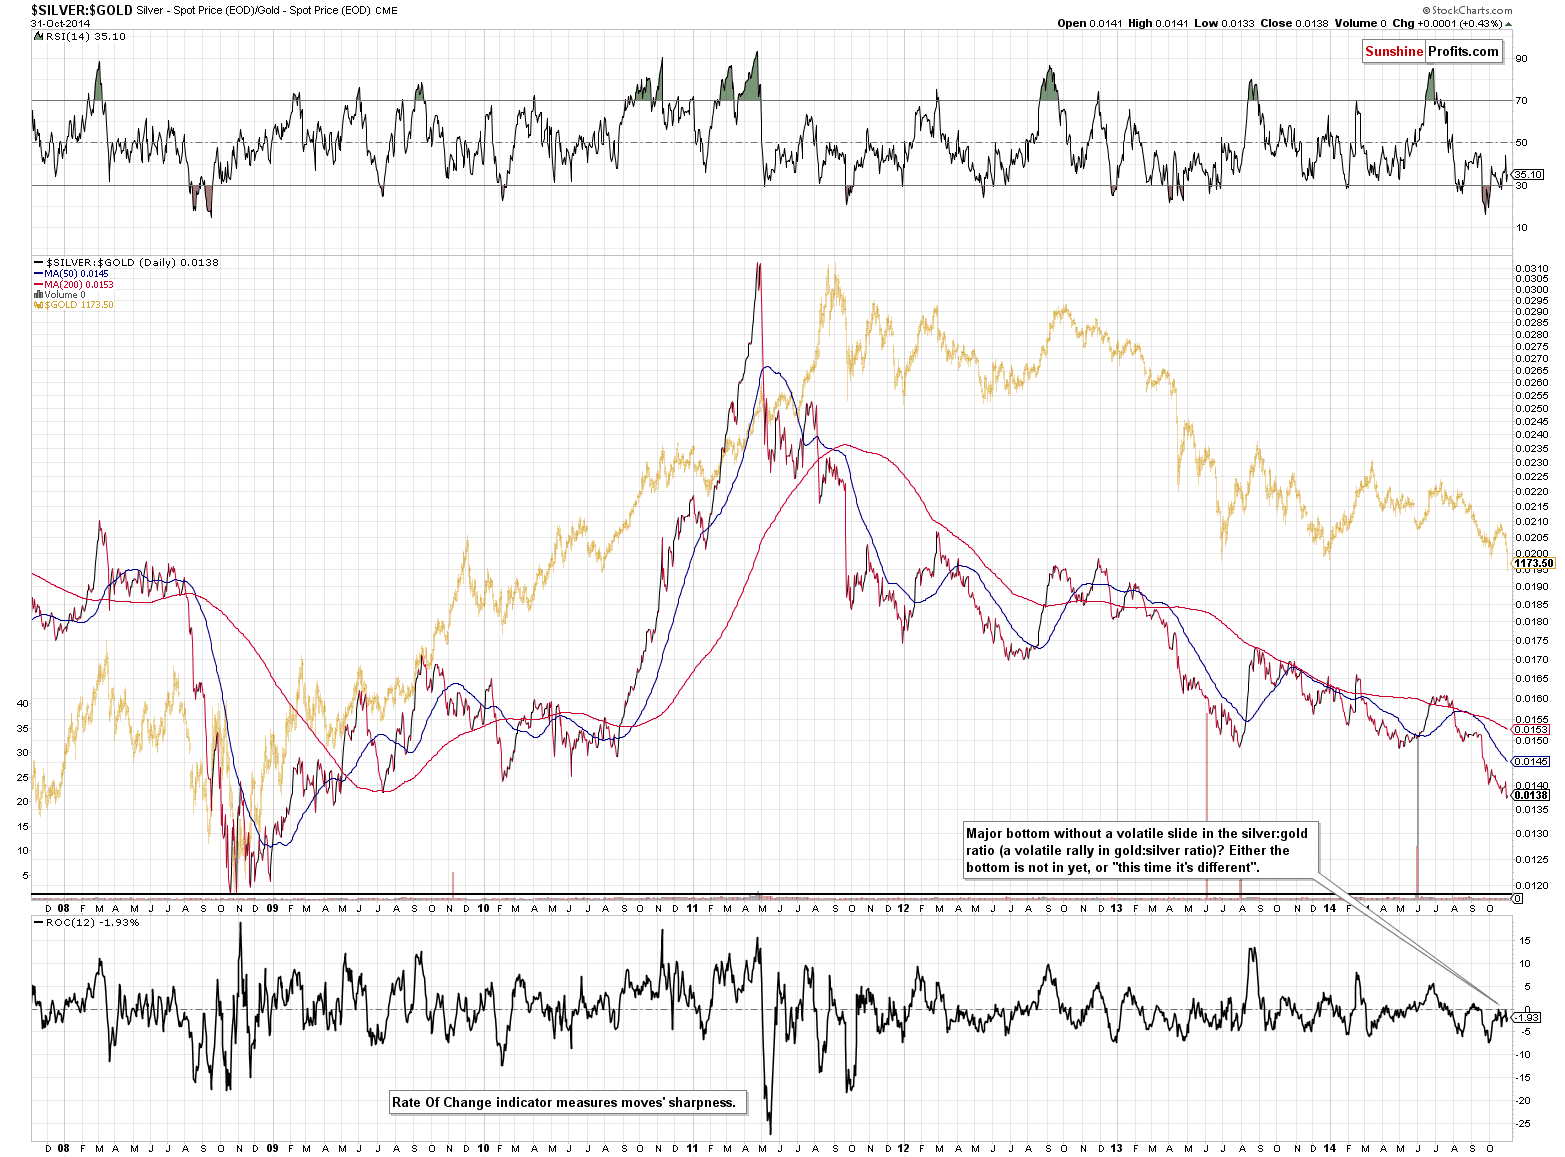
The silver to gold ratio is one of the things that we are watching closely even when we don’t mention it. What does it tell us at this time? That the final bottom is likely not in just yet. The reason is that the previous declines were usually accompanied by sharp declines in the silver to gold ratio (meaning, extreme underperformance of the white metal) and we have not seen this kind of performance recently. The Rate of Change indicator (bottom of the above chart) didn’t plunge recently, so it seems that the final bottom is still ahead of us.
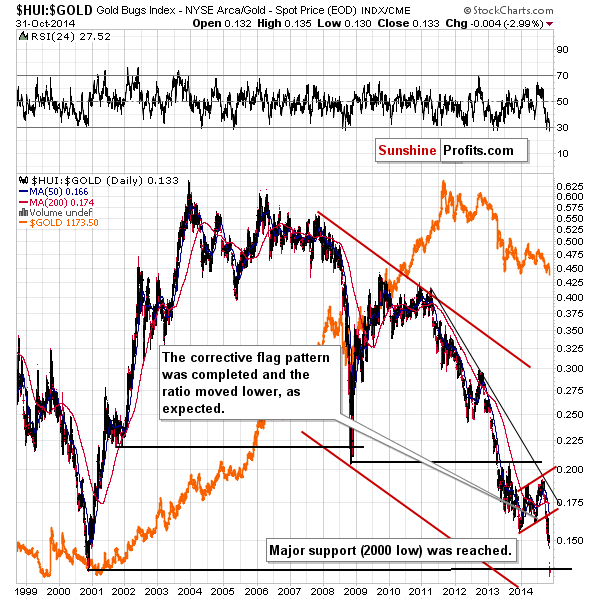
The gold stocks to gold ratio moved to a major support level – the 2000 low. In other words, if someone purchased gold stocks (on average) at the 2000 bottom in order to multiply gold’s gains and someone else just bought gold, they would both have the same amount of money at this time.
As you may recall, the HUI to gold ratio at its 2000 bottom is one of the things that we were expecting to see as the final bottom confirmation. However, at this time there are not enough additional signs to change the overall outlook (based on the silver to gold ratio, for example, we are likely to see further declines).
Can the above chart not mean that the final bottom is in? Yes. There were generally 2 cases, when the ratio dropped sharply and approached important (not as important as this one, but still), long-term support levels: in 2008 and in early 2013. In both cases the previous lows didn’t stop the decline. In 2008 there was a small move below the support level before gold stocks rallied again and in early 2013 there was only a corrective upswing to the 2008 low that verified the breakdown – declines followed.
Consequently, our reply to the how significant is the move in the HUI to gold ratio to its 2000 low question is: not that significant as it’s not accompanied by many additional signals.
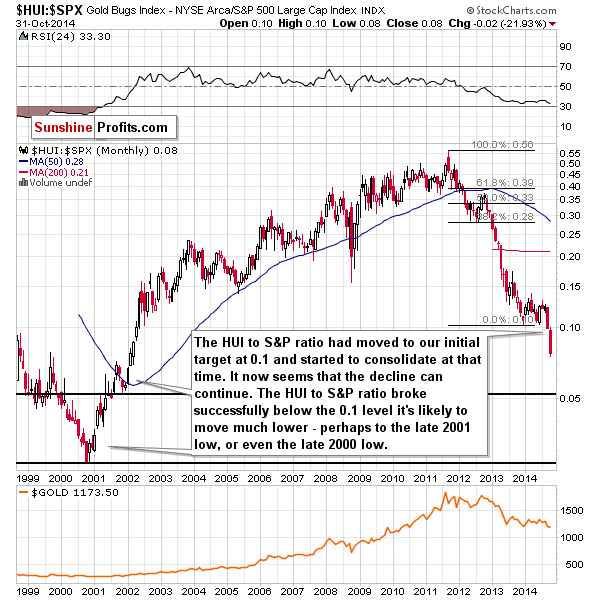
The ratio between gold stocks and other stocks ended the 2014 consolidation and broke below the previous lows. In this case, the next strong support is still very far. The implications for the precious metals sector are bearish. Interestingly, this ratio moved to its support level during the 2008 bottom – something that we have yet to see during this decline.
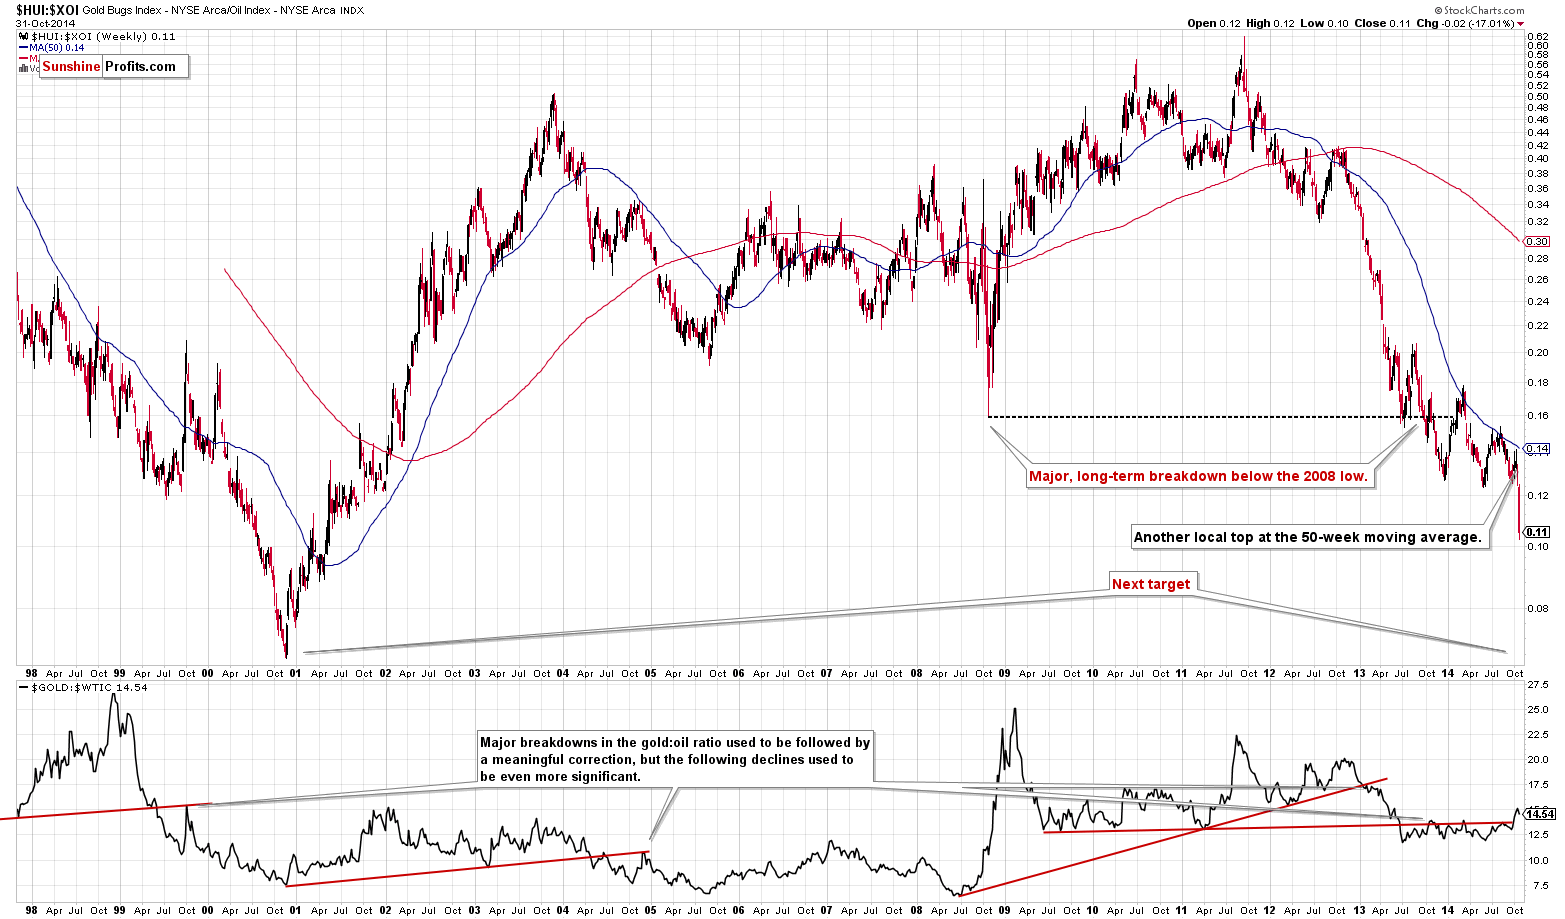
The ratio between gold stocks and oil stocks is also declining and it’s far from the next strong support.
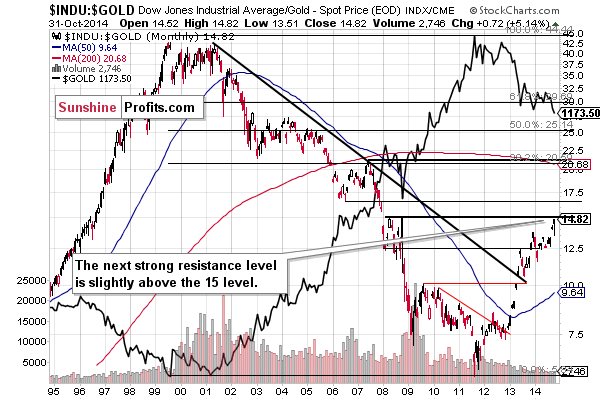
Before summarizing, let’s take a look at the Dow to gold ratio. It moved close to its resistance level, but it’s not yet at it. Since this level has not been reached yet, we could see some more upside before the top in the ratio and a bottom in gold are in. Still, this ratio suggests that the size of the potential decline in gold is rather small. Since gold has just broken below the major support level and based on the above ratio it’s likely to decline a bit more, it means that the breakdown below the support in gold is likely to be confirmed and more visible. This, in turn, means that gold could drop much more – ultimately a confirmed breakdown in gold will be more meaningful than a move in the ratio based on the yellow metal.
Consequently, perhaps the Dow to gold ratio will move more visibly above the 15 level before it tops. The next resistance is at the ratio’s 2006 low.
All in all, we can summarize the situation in a similar way, as we did on Friday.
Summing up, the situation in the precious metals market was bearish and metals and miners were likely to decline – and they did. Will they decline further based on gold’s major breakdown (after all, gold didn’t break down from more than a yearly consolidation pattern to decline $20) or will the resistance and turning point in the USD Index trigger a bigger upswing in the precious metals sector?
As always, there are no sure bets in any market, but we think that the short-term resistance in the USD Index (given the metal’s negative correlation
Consequently, we think that instead of closing the short positions, we will keep them “almost closed”. By this we mean moving the stop-loss orders lower once again. In this way, if gold, silver and mining stocks rebound, the short positions will be automatically closed and substantial profits will be secured anyway. If metals and miners continue to slide, we plan to continue to move the stop-loss order lower and thus make the substantial profits from the current short positions even bigger. Please note that by entering a new stop-loss order, you are effectively making sure that the current trade is profitable no matter what the market does.
The fact that XAU and HUI moved very close to their 2008 lows and the HUI to gold ratio moved to its 2000 low doesn’t have to mean that the bottom is in at this time. Gold moved below its 2013 low and it doesn’t look like it’s ended a huge triangle-shaped consolidation to decline $20 or $30 dollars. If it continues to slide, the move could be very sharp and miners would likely follow.
We will continue to monitor the situation and provide our insights in our daily (or intraday if the situation requires it) Gold & Silver Trading Alerts.
To summarize:
Trading capital (our opinion):
It seems that having speculative (full) short positions in gold, silver and mining stocks is a good idea:
- Gold: initial target level: $1,107 ; stop-loss: $1,187, initial target level for the DGLD ETN: $96.83 ; stop loss for the DGLD ETN $79.90
- Silver: initial target level: $15.07 ; stop-loss: $16.56, initial target level for the DSLV ETN: $93.83 ; stop loss for DSLV ETN $72.29
- Mining stocks (price levels for the GDX ETN): initial target level: $14.07 ; stop-loss: $18.33, initial target level for the DUST ETN: $73.11 ; stop loss for the DUST ETN $38.03
In case one wants to bet on lower junior mining stocks' prices, here are the stop-loss details and initial target prices:
- GDXJ: initial target level: $18.57 ; stop-loss: $26.53
- JDST: initial target level: $59.49 ; stop-loss: $25.80
As a reminder – “initial target price” means exactly that – an “initial” one, it’s not a price level at which we suggest closing positions. If this becomes the case (like it did in the previous trade) we will refer to these levels as levels of exit orders (exactly as we’ve done previously). Stop-loss levels, however, are naturally not “initial”, but something that, in our opinion, might be entered as an order.
Long-term capital (our opinion): No positions
Insurance capital (our opinion): Full position
Please note that a full position doesn’t mean using all of the capital for a given trade. You will find details on our thoughts on gold portfolio structuring in the Key Insights section on our website.
Our preferred ways to invest in and to trade gold along with the reasoning can be found in the how to buy gold section. Additionally, our preferred ETFs and ETNs can be found in our Gold & Silver ETF Ranking.
As always, we'll keep you - our subscribers - updated should our views on the market change. We will continue to send out Gold & Silver Trading Alerts on each trading day and we will send additional Alerts whenever appropriate.
The trading position presented above is the netted version of positions based on subjective signals (opinion) from your Editor, and the automated tools (SP Indicators and the upcoming self-similarity-based tool).
As a reminder, Gold & Silver Trading Alerts are posted before or on each trading day (we usually post them before the opening bell, but we don't promise doing that each day). If there's anything urgent, we will send you an additional small alert before posting the main one.
Would you like to stay updated on our free alerts (like the one that you've just read)? Sign up for our free mailing list today - it will take just a few seconds and you can unsubscribe just as easily.
Thank you.
Sincerely,
Przemyslaw Radomski, CFA
Founder, Editor-in-chief
Gold & Silver Trading Alerts
Forex Trading Alerts
Oil Investment Updates
Oil Trading Alerts
