
Based on the February 1st, 2013 Premium Update. Visit our archives for more gold & silver articles.
Gold moved sideways for the last six weeks, with each rally and correction sparking either new hopes or new fears about the yellow metal. But focusing on such short-term volatility can rarely bring any good when it comes to long-term investments. That’s one of the things that we often stress – one should always analyze the market form different perspectives and keep in mind their order of importance. This week we will focus on the long term.
Another thing, that we have already mentioned, is that such universal commodities, traded on many exchanges and in many currencies, like gold ought to be assessed taking other currencies into consideration. Hence, to get a clearer, distilled from the short-term noise picture of the situation in gold, today we will focus mostly on long- and medium-term charts, as well as on the yellow metal priced in currencies other than the U.S. dollar.
To see what awaits the gold price in February 2013 let’s turn to this week's technical part. We will start with the yellow metal’s long-term chart (charts courtesy by http://stockcharts.com.)
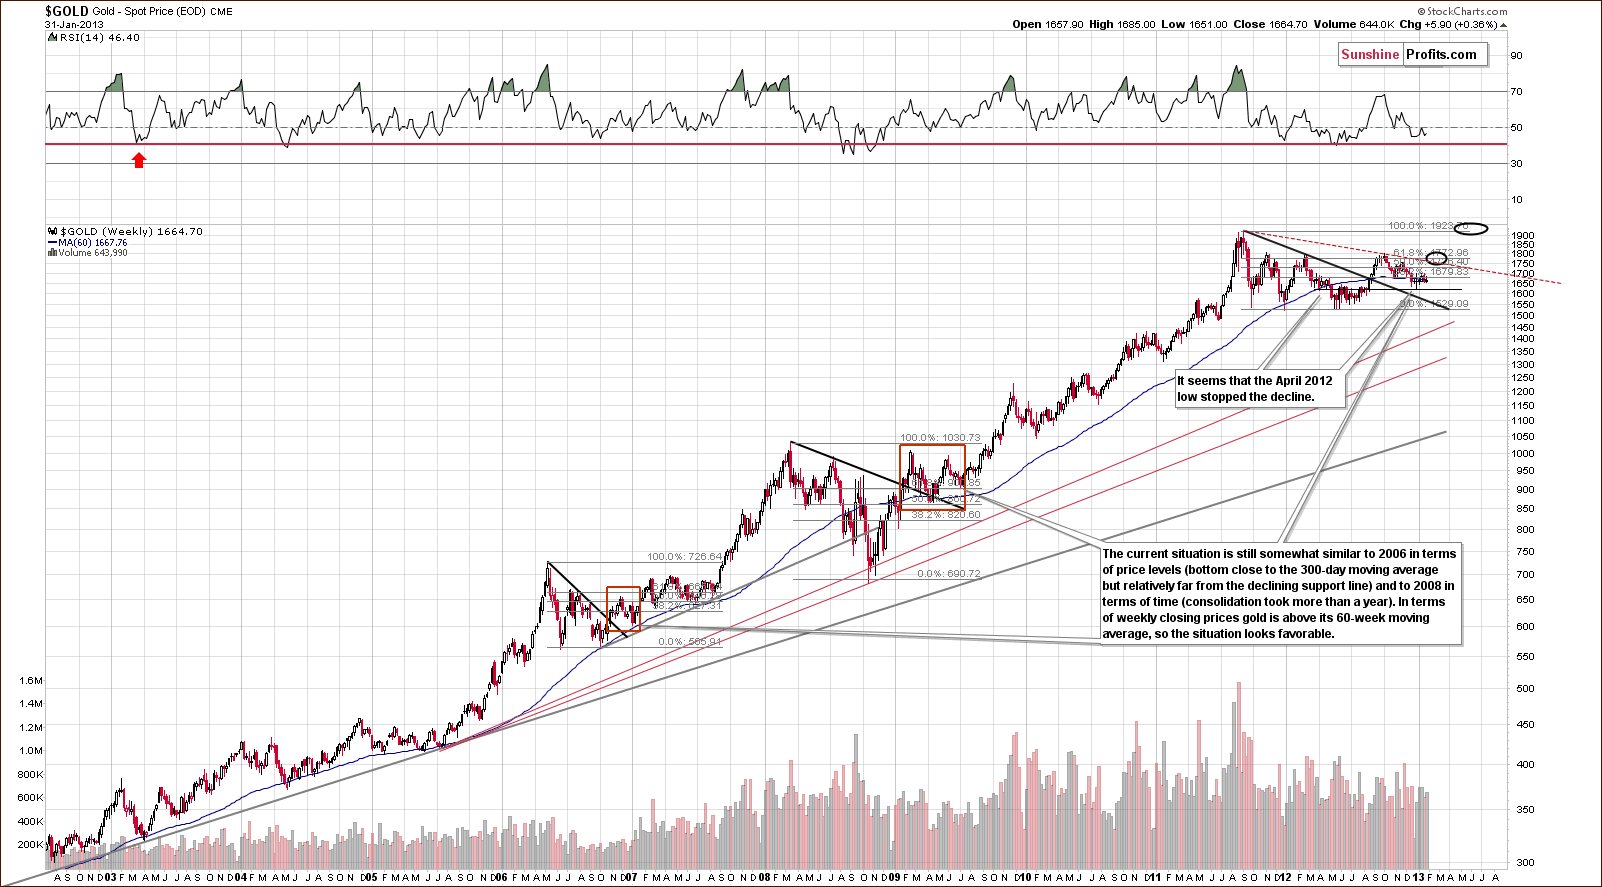
Little change has been seen in this chart this week, but it is important for a reason which will be touched on when we summarize this essay. The bottom was very likely formed here a few weeks ago when gold prices dipped below the 300-day moving average, which is a very important long-term technical development. Prices now appear to be simply consolidating a bit, which is also in tune with the historical patterns – the rally didn't always start in a volatile way after the final bottom was reached below the 300-day MA – but it happened eventually many times and on each occasion the rally was worth waiting for.
Let us now move on to the yellow metal’s medium-term chart – we will use GLD ETF as a proxy.
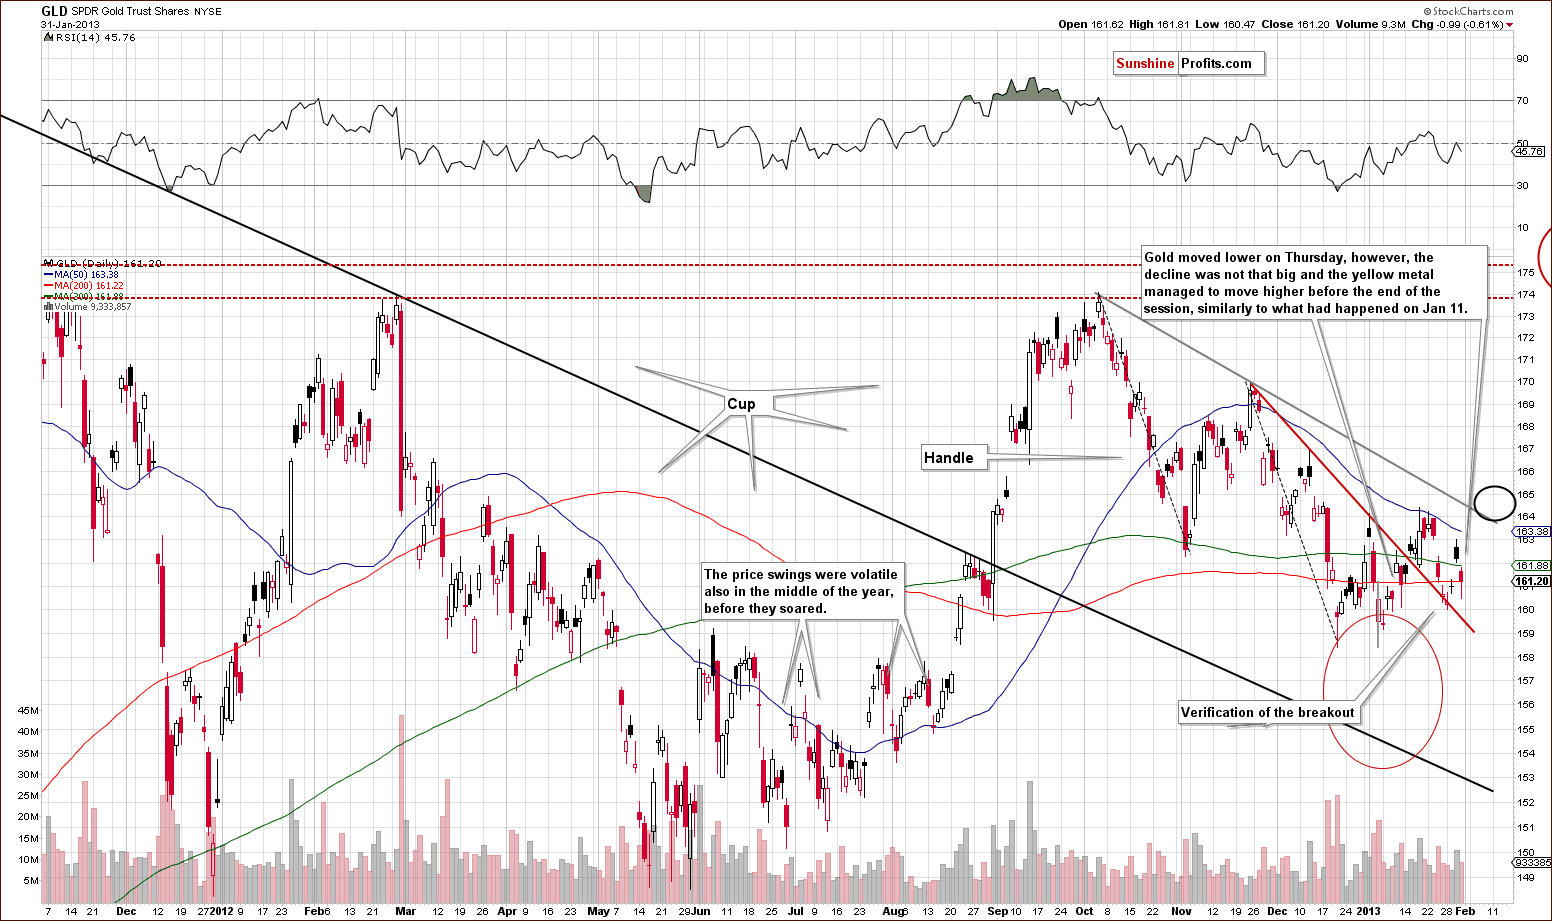
Here, we see that prices moved lower this week but are still above the declining short-term resistance line. While significant volatility has been seen on a short-term basis, the average price has moved very little over the last month and a half.
The situation is very similar to mid-2012, where back and forth price movement was eventually followed by a huge rally. Those whom were not prepared, say last August, would have missed a large part of the upside move.
The price action seen on Thursday was quite similar to January 11, where gold corrected after a short-term powerful upswing and managed to move higher before the end of the session. The outlook was bullish then and we think it’s bullish right now as well.
The rally will likely really pick up after gold moves above the declining medium-term resistance line (black ellipse on the above chart). However, does the move higher have to happen immediately?
Let us have a look at two charts featuring gold from the non-USD perspective – we’ll start with gold priced in euro.
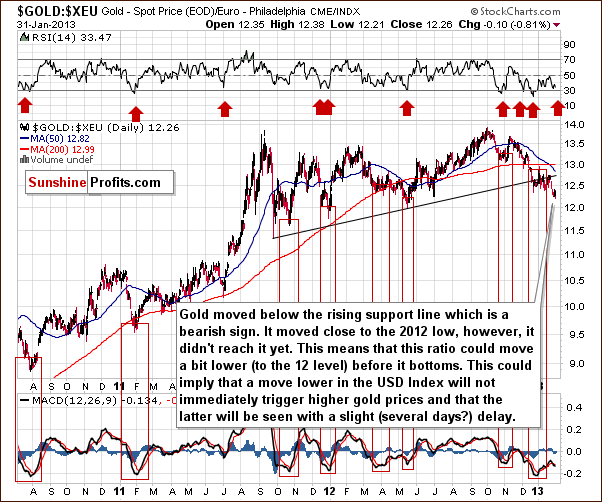
In this chart we saw a breakdown below the rising resistance line and the next support line is at the 2012 low. Since this level has not been reached yet, it seems we could see some weakness on a short-term basis.
Does gold have to decline based on that – from the USD perspective? Not necessarily. Quite simply, gold could not rally immediately if the dollar declined. Gold priced in euro could move slightly lower and if gold then catches up or rallies more significantly then the dollar declines, the price of gold in euro would rally. This chart does have some clearly bearish implications, however.
Let us proceed to the second chart that shows a completely different picture – gold from the perspective of the Japanese yen.
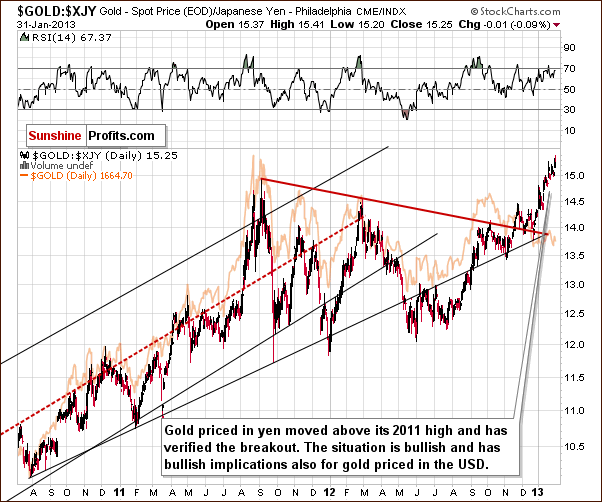
Here, the outlook is bullish as a breakout above the 2011 high has been seen. More importantly, the breakout was verified as prices stayed there for more than 3 consecutive trading days.
Summing up, quite a few strong signals are seen in the gold charts this week. Gold price in euro is a bit bearish, and price volatility can be expected in the coming weeks. With so much going on, and so many factors in place, we feel we must emphasize keeping what’s most important right in front of you. This is crucial and is why we keep featuring gold from the very long-term perspective, even though quite often, there are little changes from week to week.
The main point is that gold moved below the 300-day moving average (after already a lengthy consolidation) and then back above it. This accompanied major bottoms in the past, and we think that another is once again behind us. The ongoing debate now is whether consolidation will end immediately or if we will witness more sideways trading before the rally proceeds. The fundamentals are in place and gold will seemingly have to eventually rally. Taking all volatility signals along with the long-term gold picture into account, it seems that the next move will be to the upside, not down as the gold in euro picture might suggest. As far as long-term investments are concerned, we believe that staying in the market with your gold and silver holdings continues to be a good idea.
Thank you.
Sincerely,
Przemyslaw Radomski, CFA
