

Gold soared yesterday, likely based on the escalation of the trade conflict between the U.S. and China, but after several hours the rally was over. The tensions didn’t really subside, but the price of gold is already about $10 below the price at which it was trading when yesterday’s rally had started. Is gold trying to say something? No. It’s not saying – it’s screaming.
There is a combination of two factors that makes the current situation particularly interesting and meaningful. The first factor is what we already discussed in the previous alerts – gold’s decline was delayed because new bullish fundamental news kept emerging. We wrote that eventually there would be no new bullish news and that the price of gold would move back to its default mode and resume its decline.
The second factor is that if a given market no longer reacts to factors that should trigger a specific kind of reaction, then it’s a clear sign that the market is about to move in the opposite direction. Yesterday’s session in gold showed exactly that – gold should have rallied, and it did – but only initially. There was not enough buying power to keep pushing gold higher. In fact, buyers were not even able to prevent gold’s decline in the final part of yesterday’s session. Today’s pre-market downswing (gold is at about $1,325 at the moment of writing these words) confirms that the buying power (at least temporarily) almost dried up.
Combining the two previous paragraphs gives us a picture in which gold is not only unwilling to rally substantially based on positive news – it’s not even likely to rally temporarily based on them. It means that both: gold’s next move is likely to be a sizable downswing and that the time for the consolidation is up or almost up.
Before we move to charts, we would like to explain how the market tends to react if it really wants to move in one way (here: decline), but the fundamentals keep interrupting it (here: bullish fundamental gold news - news that’s bullish from the fundamental point of view). We’ll not going to explain a sophisticated econometric model for this and we’ll not going to use terms as first derivative or diminishing marginal returns. Instead, we’ll use a simple analogy to something from real life. It will not be a pleasant analogy, but if it generates any emotions, then it’s more likely that it will be easier to keep in mind.
Think of a hardcore drug addict. They have to keep on getting more and more of their “stuff” to keep them happy. They have to constantly increase the amounts of drugs that they take to get the same effect. Even though the final effect is the same – they get their “enjoyment” - the cause is only the increase in dosage. If they didn’t increase it, they would get smaller effects up to the point when it would not be noticeable. If they stop taking the drug at all (eventually, they are likely to run out of it, or their health is too damaged), their “enjoyment” turns into a nightmare.
Similarly, the price needs more and more bullish news to keep on rallying and at some point, the same amount of news (or the same importance of them) will start to generate smaller and smaller rallies. It would take more dramatic and more bullish pieces of news to trigger the same upswings. If the bullish news dosage stays the same, the price will rally at a slower pace and finally stop to rally at all. Once the bullish news is gone (or we have bearish news), the rally turns into a decline.
Yesterday’s session in gold likely shows the final stages of the above cycle and the implications are very bearish.
Having said that, let’s take a look at the charts starting with gold (chart courtesy of http://stockcharts.com).
Gold’s Daily Reversal
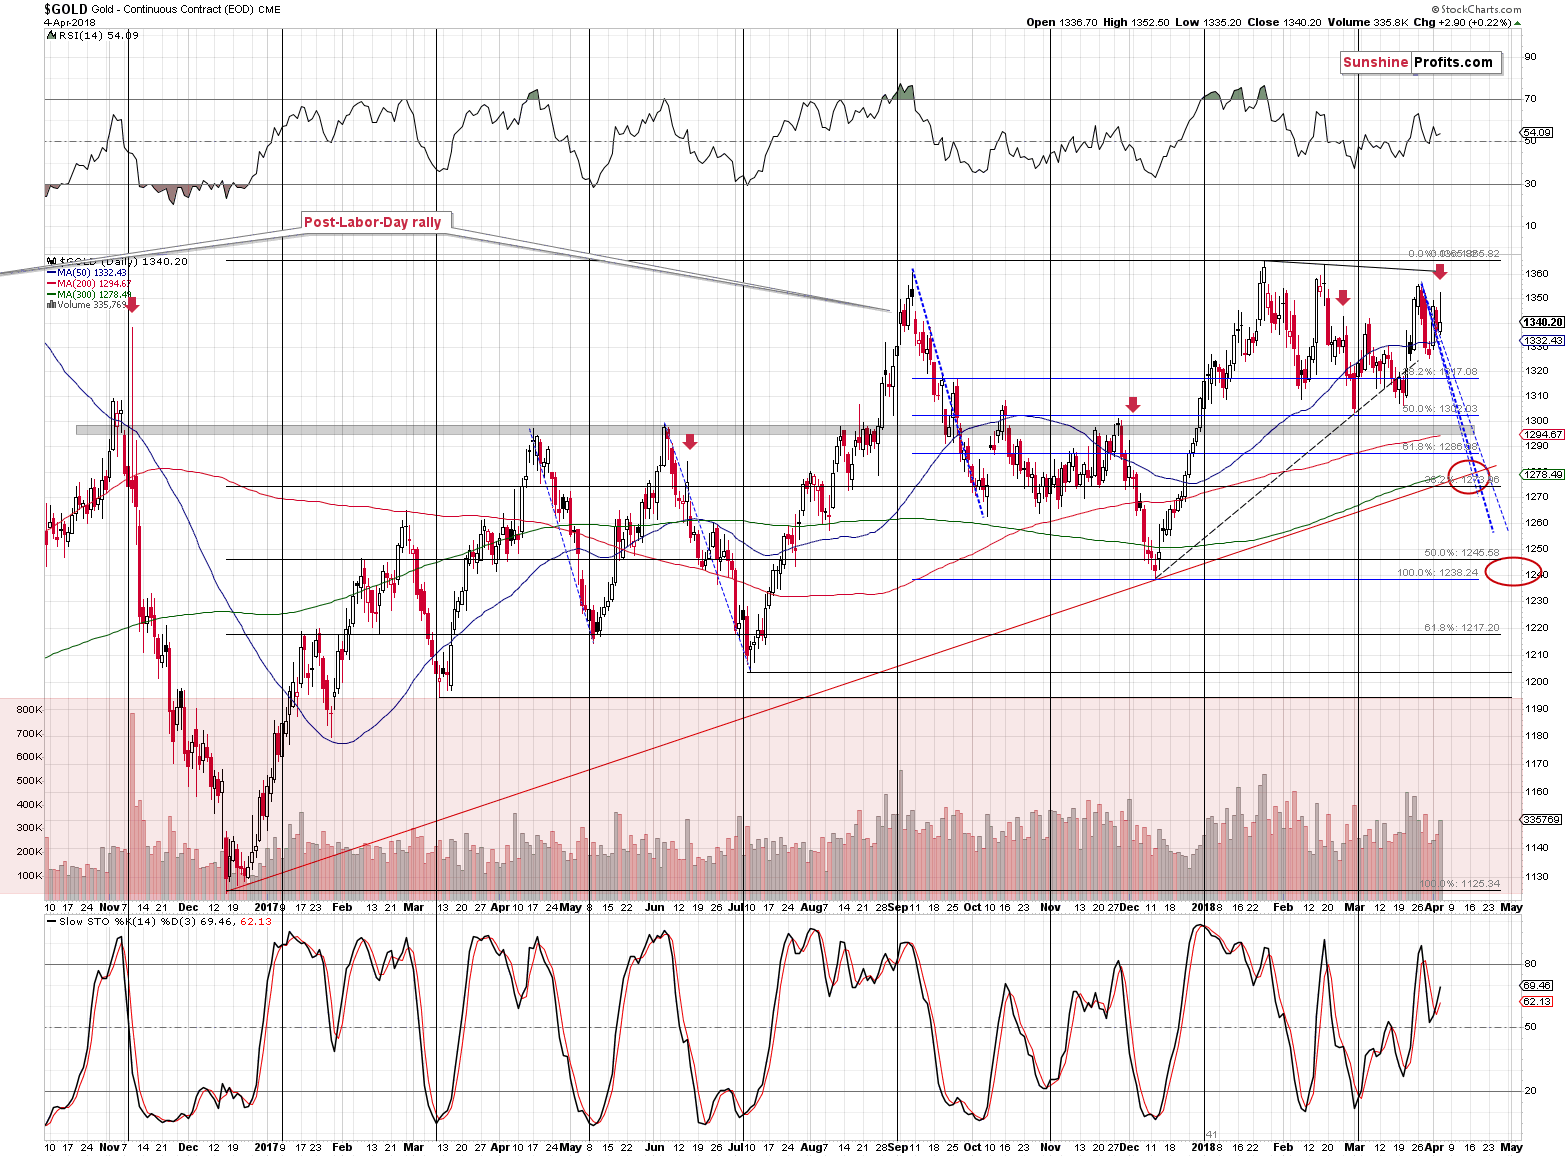
Technically speaking, gold reversed on significant volume, which is a classic sell signal. The implications are even greater than based on just the above, because we also have supporting analogies. Namely, this is the kind of reversal that we saw quite a few times before big slides, but after tops in terms of daily closing prices. We marked those cases with red arrows.
The most prominent example is early November 2016 and we can see the remaining ones (that are actually more similar to the current situation) in June 2017, on Dec 1, 2017 and in late February 2018. They were all followed by declines practically right away and it seems that today’s pre-market decline proves that history is repeating itself. It was not a good idea to be invested in gold back then, it’s doesn’t seem to be a good idea right now (except for the insurance capital, that is).
Silver’s Daily “Strength” Invalidated
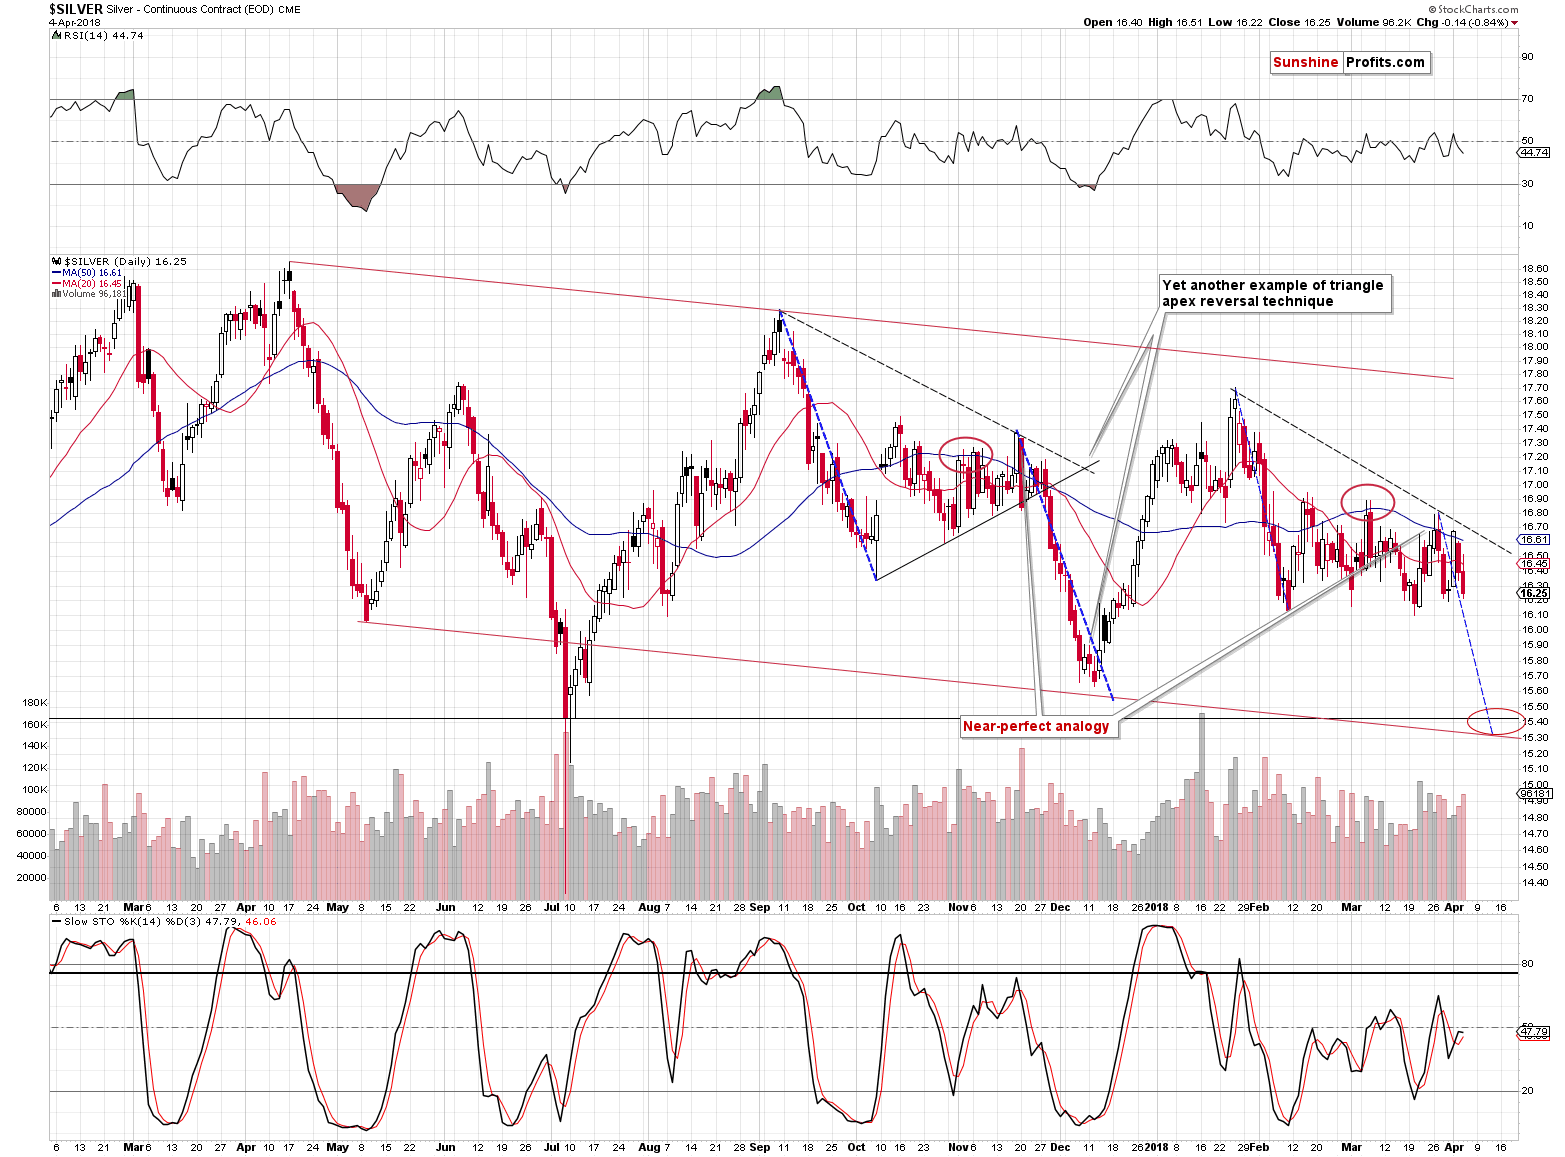
As you can see on the above silver chart, this week’s early strength is now fully invalidated. Actually, in today’s pre-market trading, silver even moved below the late-March low. In the previous articles, we warned you not to trust the silver upswing and it was indeed followed by lower prices practically immediately.
Please note that for more than a week, silver’s daily declines have been accompanied by volume that’s higher than what we have seen during daily upswings. The implications are bearish.
In terms of the analogy to the pattern that we saw from September 2017 to early December 2017, we are now likely in a situation similar to Nov. 28, 2017 – right before the decline.
Miners’ Underperformance Continues
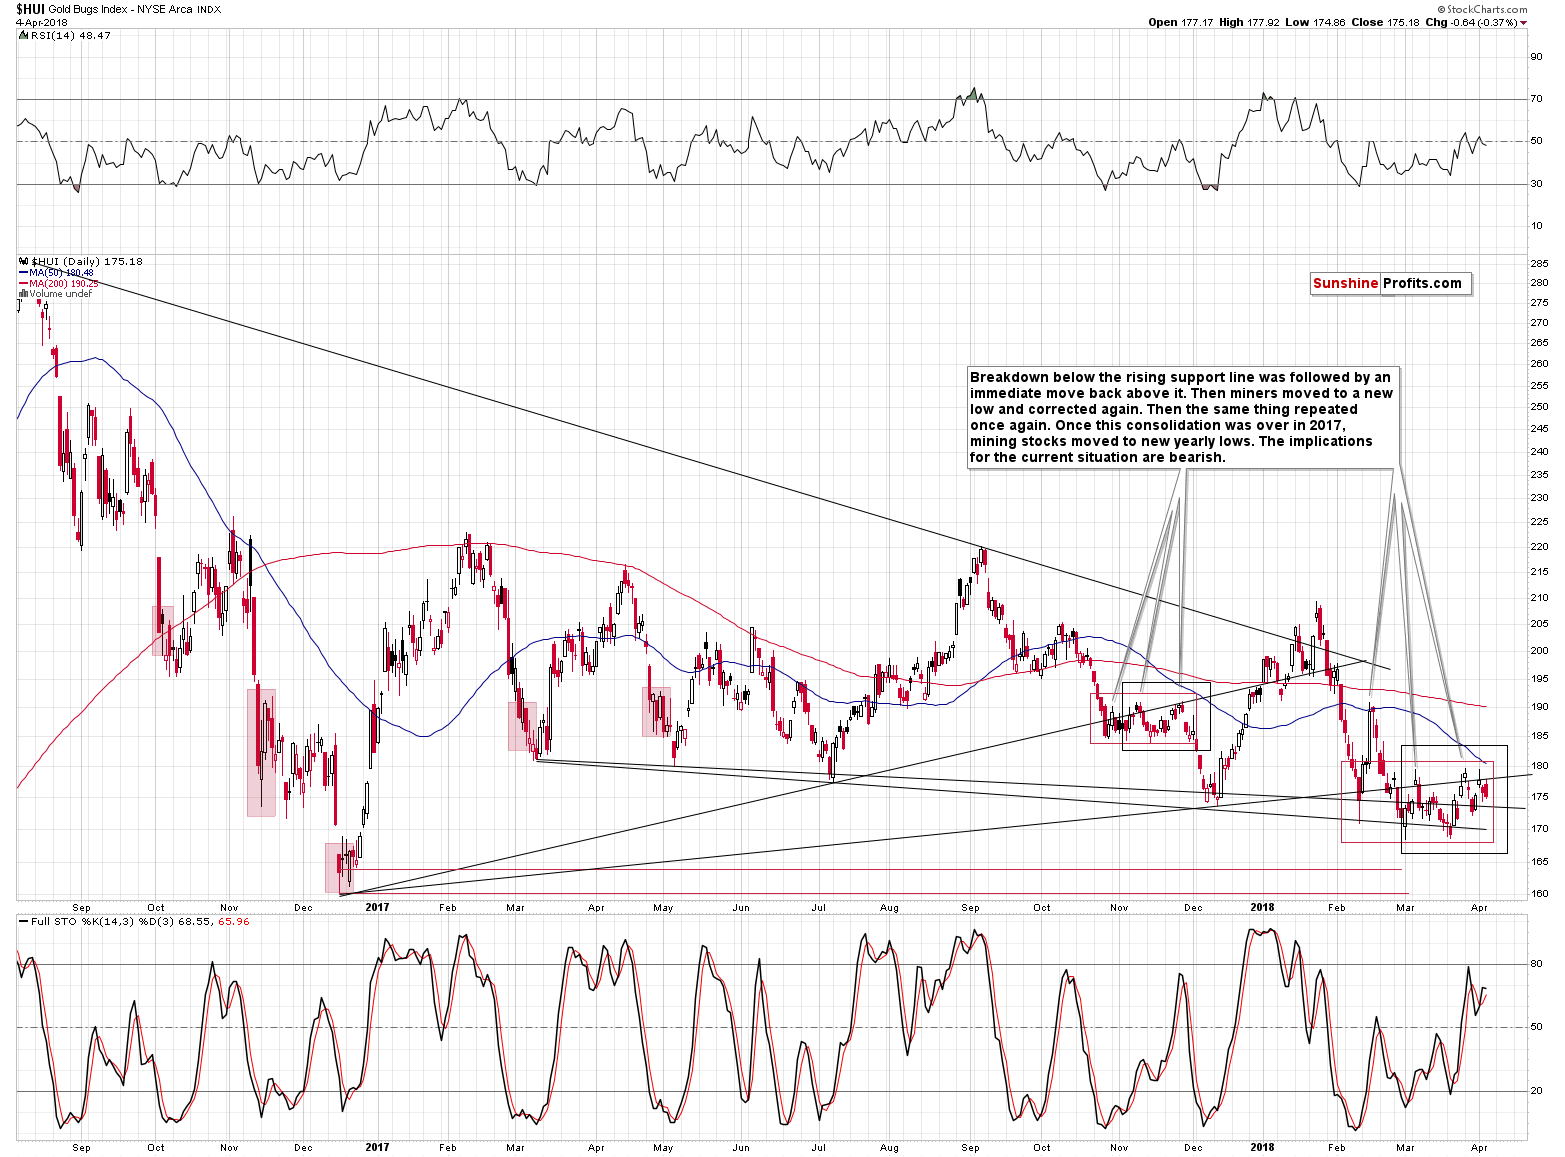
Even though gold moved a bit higher yesterday, gold stocks declined. That’s yet another clear sign of underperformance of the miners. The implications thereof remain bearish.
The EUR/USD Trigger
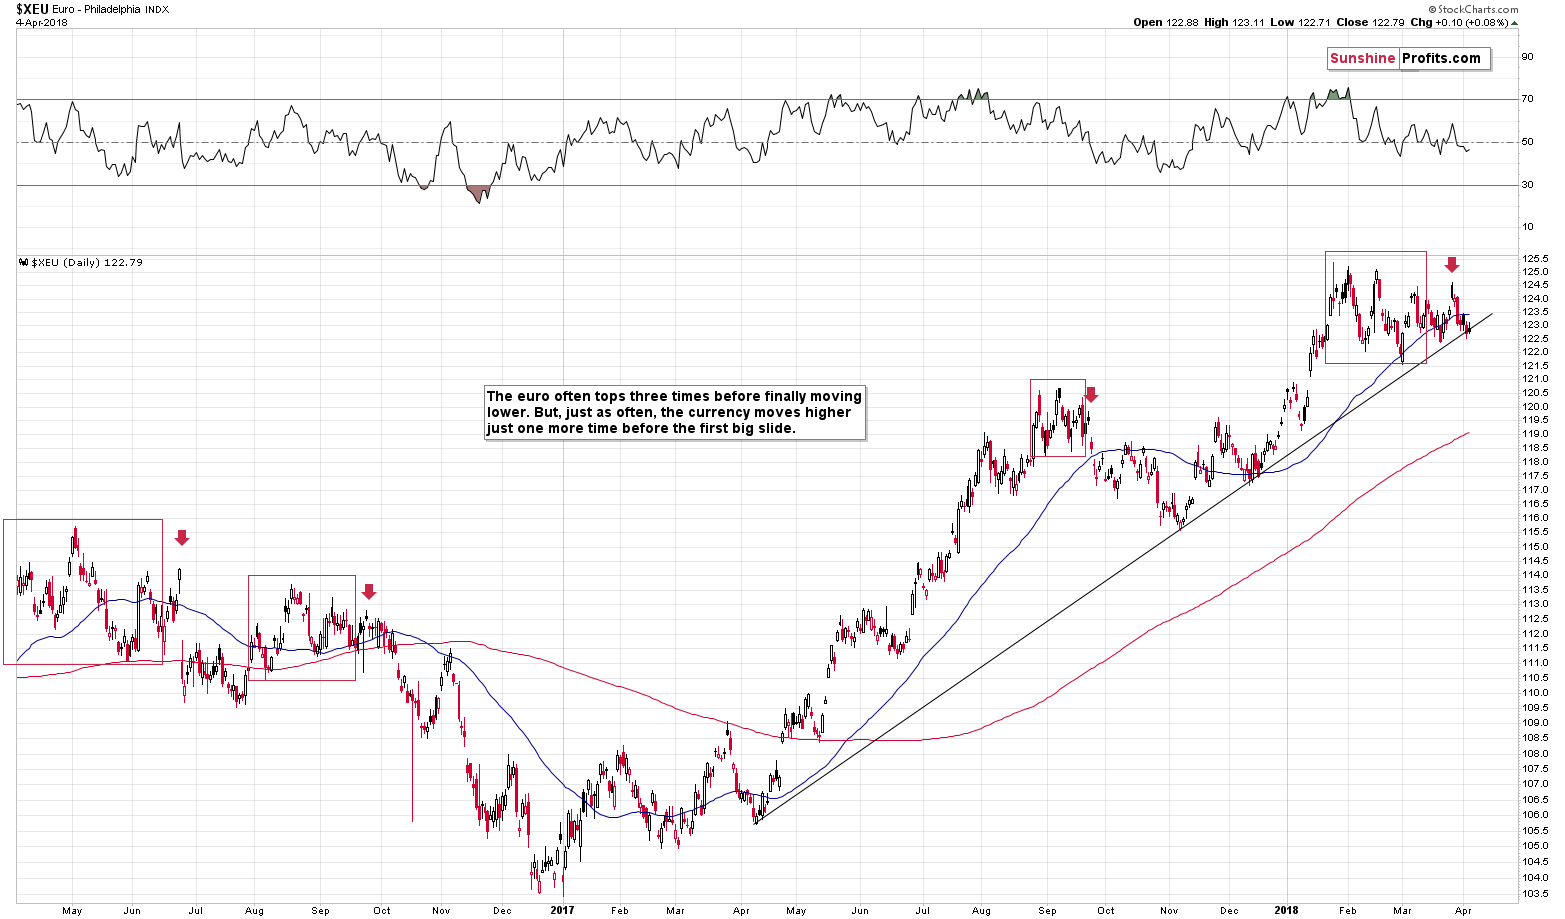
In yesterday’s alert we wrote that the situation in the EUR/USD currency pair remained tense and we wrote that it the pair was likely to break below its rising medium-term support line sooner rather than later. We wrote the following:
This support is what’s keeping the currency pair in check, which in turns keeps the USD Index in check. But, i.a. based on the triple-top formation it seems that we’ll see a big breakdown in the euro relatively soon. The implications are bullish for the USD Index and bearish for the precious metals sector.
The above remains up-to-date. The thing that we would like to add today is that despite the increased trade conflict tensions the USD’s value didn’t really decrease, which can be a sign that it really wants to move higher, not lower. That’s in perfect tune with our technical analysis of the USDX and also a factor supporting the scenario in which the EUR/USD pair breaks lower shortly.
Summary
Summing up, the fact that gold reversed its initial news-based rally is a very bearish sign for the following days and it suggests that the prolonged consolidation is over. Meanwhile, the next reversal date is looming, and it’s another reason that suggests that we’ll either see a decline shortly or that we’ll see more back-and-forth movement and a decline on April 9 or close to this date. The former is more likely at the moment. The Euro Index is on the verge of breaking lower, which is likely to push the USD higher and trigger a slide in the PMs. In other words, it doesn’t seem to be a good idea for one to keep a lot of gold in their portfolio at this moment.
Naturally, the above is up-to-date at the moment of publishing it and the situation may – and is likely to – change in the future. If you’d like to receive follow-ups to the above analysis (including the intraday ones, when things get hot), we invite you to subscribe to our Gold & Silver Trading Alerts.
Thank you.
Sincerely,
Przemyslaw Radomski, CFA
Founder, Editor-in-chief, Gold & Silver Fund Manager
Gold & Silver Trading Alerts
Forex Trading Alerts
Oil Investment Updates
Oil Trading Alerts
