
This essay is based on the Premium Update posted on January 21st, 2011. Visit our archives for more gold & silver articles.
In our previous free essay weve mentioned that mining stocks are at a particularly important crossroad, and whichever they decide to move is likely to determine the way for the underlying metals as well. In the following article we will put another factor into the equation the general stock market.
Lets start with the long-term S&P 500 chart (charts courtesy by http://stockcharts.com.)
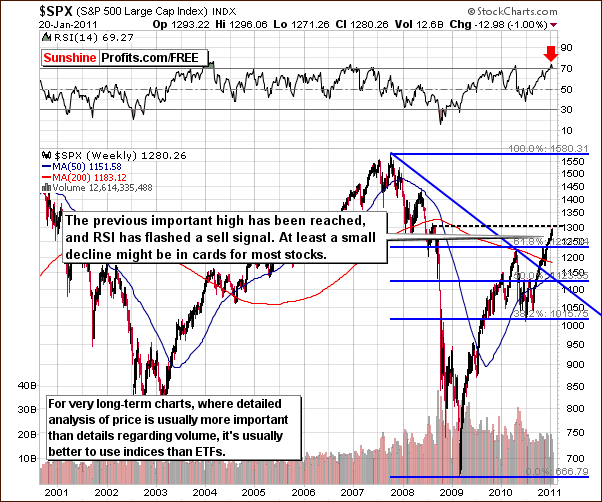
In the very long-term S&P 500 Index chart this week, we see that an important resistance level has been reached. This is equal to the late 2008 high, which was followed by a quick and severe decline. The price action, which followed this high towards the end of 2008 and this 1,300 level itself are therefore important factors (from the psychological point of view) from which some possible 2011 projections can be made.
At this point we would like to digress a bit. One might ask - why does the previous high make a resistance level? The answer is that people tend to see trades in only two ways win or loss. Most people would see bigger difference between winning $1000 and losing $1000, then between losing $6000 and losing $9000. That is because in the first situation one is faced either win or loss, and in the second situation is a loss either way. Still, the second situation is more important, because the difference between two outcomes is 50% higher ($2,000 vs. $3,000). The vast majority of Investors and Traders originally became Investors and Traders to make money; however most people ultimately find it more important to feel that they are winning than that they make money. In this case, most people would consider the difference between $-1,000 and $1,000 as more important than the one between -$6,000 and -$9,000.
Another way to put it is to take a look at the question that Investors and Traders sometimes ask I agree that the market is going to move lower, but my speculative long position is at a loss, so should I sell? The answer is of course if you think the market is going to move lower than you should close your long position, period. How much weight should one put to the fact that the position is already at a loss? None. If one believes the market is going lower, then ones loss would turn into a bigger loss and why would anyone even consider wanting to have a bigger loss?
The real answer is that because that it requires one to admit that the position that one has previously entered turned against them. One feels responsible for it and wants it to be closed at a profit. What one fails to realize at this point, is that the same position could be re-opened at lower prices, which would make it even more profitable in the end. Again one often takes into account the win/loss psychological factor instead of calculating profitability of each action.
Consequently, one maximizes the times that they are holding a winning position, but not their overall rate of return. For instance its better to lose $10 and gain $110 than to gain 20$ two times.
The abovementioned phenomenon alone makes the previous highs and lows important resistance/support levels. Many investors but at the top or very close to it (thats why we usually see strong volume at/close to local tops), and once price declines they never sell waiting to close their position at no loss whatsoever. Consequently, they sell when price moves to the previous high, since it is their purchase price. So, many Investors/Traders, who purchased stocks in August and September 2008, were waiting for the price to reach the price levels that we have just seen, in order to sell their stocks. This strong selling pressure is naturally a bearish factor.
The previous top is not the only bearish factor that we see today. We also have an interesting situation in other stock indices where a non-confirmation is in fact a confirmation of the previous points. Lets take a look below for details.
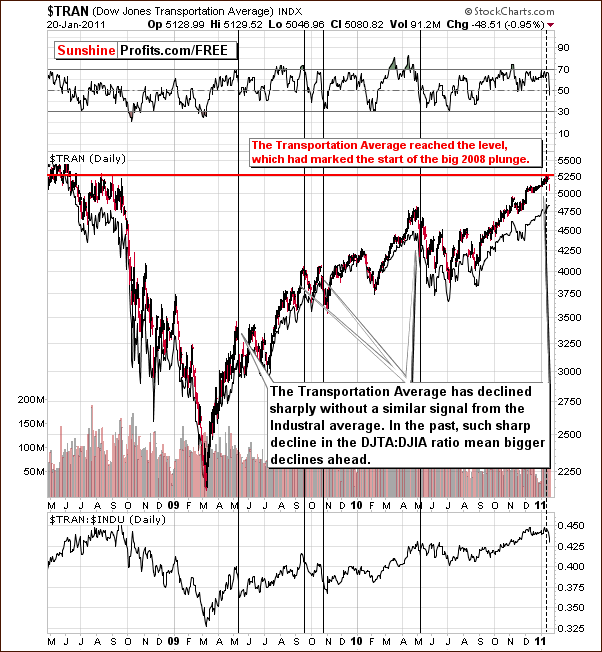
According to the classic Dow Theory the signals from the industrial average should be confirmed by the ones seen in the transportation average. Without that a signal does not mean much.
Here, we are using this divergence in a slightly different way. In the past few days we have seen a sharp decline in the Dow Jones Transportation Average, without a similar action in the Dow Jones Industrial Average. In order to isolate this relative phenomenon, we have included a transportation:industrial stocks ratio below the price chart. Here, we clearly see that the ratio moved quickly lower recently.
Since this signal is quite clear, lets take a look what it meant in the past. The fact is that in the past it was an early warning about the coming decline. In the past, declines such as this were seen to continue for days or even weeks. The implication here further confirms the short-term bearish case for stocks. Speaking of implications, let's take a look below, at our correlation matrix.
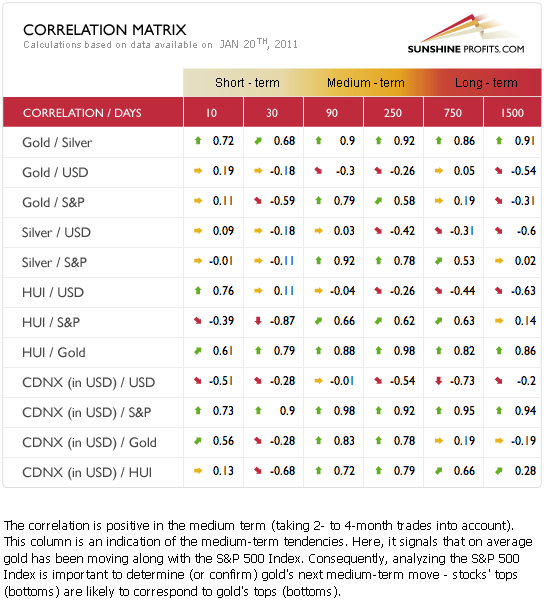
In this weeks Correlation Matrix, the short-term coefficients are not as significant as in weeks past. There appears to be a slight negative correlation between metals and stocks but this does not hold true for silver.
It seems that the medium-term coefficients (90-day and 250-day columns) are of more value at this time. Recent breakdowns have been seen in many of the markets this week but in most cases have not yet been verified. The situation is such that if these breakdowns are verified in the days ahead, the impact will likely be felt for weeks and therefore the medium-term columns will provide valuable insight.
Only the general stock market appears to have a significant influence on the precious metals for this time-frame. Therefore, if stocks decline from here, the same will likely be seen across the precious metals sector for they will be dragged down as well by the declining stock prices. Although the relationship is not clearly seen on a day-to-day basis (short-term correlation is weak), the bigger move in stocks is still likely to have influence one the precious metals sector.
The above would not be such a big deal if the gold market itself provided us with bullish signals - however that is not the case right now.
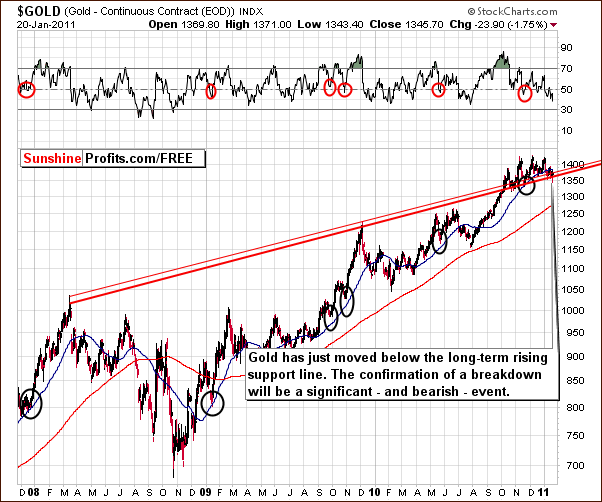
The very long-term chart for gold this week shows a key breakdown below the long-term support level. Price has declined below the 50-day moving average and slightly below the rising support line. This latter breakdown however has not been verified. Three days below this previous support level are generally required to verify such a breakdown.
Should a small insignificant move back up to this level be seen with a failure to move beyond it, it may very well be a signal to open short positions. This will be watched closely in the coming days.
Before moving to the following chart, we would like to digress once again. In the recent several weeks we have seen several moves lower, and mentioned several verifications that are needed. At this point one might get an impression that no signal is meaningful if we require verifications over and over again. That is not the case usually the point is that we are in a situation where big trends can change, and this could impact the long-term holdings in a meaningful way. Selling long-term holdings is an important decision and should be utilized only at particularly favorable (or unfavorable, if you prefer to view it this way) conditions. It is these verifications and confirmations that provide us with enough certainty that a bigger move lower or higher is in the cards thats why we have been mentioning them so often recently.
Summing up, the outlook for the general stock market is bearish for the short-term and perhaps medium-term. This bearish sentiment is likely to have a negative influence on gold, silver, and mining stocks. However, since the latter are short-term oversold, we may have a quick move up first. Should metals move up sharply, the bearish case will be invalidated. If the move lower - the plunge is not likely to be small. If you have been considering subscribing to our Premium Service to stay up-to-date with our thoughts on the market at all times, it may now be a good time to proceed.
Thank you for reading. Have a great weekend and profitable week!
P. Radomski
--
There were too many risks for 2011 to list them all at once last week, so we saved some for this week's Premium Update. There is slowdown in China, social unrest around the world due to rising food prices, hyperinflation and a few other things that can keep even the soundest sleeper awake at night. We can only take a small measure of comfort in the fact that the 2011 outlook for precious metals is very bullish.
Meanwhile, stocks have just reached a high that in 2008 marked the last stop before the epic plunge. What impact is it likely to have on the stock market and on the precious metals? Will the recent reversal in the USD Index be a bullish or bearish factor as we move forward? What about the Hindenburg Omen that we have just seen? This week's update includes replies to the above question and more.
We have examined the situation in gold, silver and mining stocks, and all of them moved below very important support levels or have just reached them. Will they still provide support, or is this a beginning of another serious decline? In addition to our regular analysis, we also explain how and why resistance levels work. Being aware of the psychological phenomenon behind it makes one less likely to follow it, which should ultimately translate into higher profits.
We encourage you to Subscribe to the Premium Service today and read the full version of this week's analysis right away - especially while the $0.01-for-the-first-3-weeks bonus is available on your account.
