
This essay is based on the Premium Update posted January 8th, 2009. Visit our archives for more gold & silver articles.
The decade just ended was one in which the U.S. endured two market crashes, one at each end of the decade, the terrorist attacks of 9/11, a war in Afghanistan and a fiasco in Iraq that still drag on, Wall Street scandals highlighted by Enron, Hurricane Katrina, and the recent near economic meltdown. Is it any wonder then that Time Magazine couldnt quite decide how to call this decade? The magazine came up with a few names: Decade from Hell, or the Reckoning, or the Decade of Broken Dreams, or the Lost Decade.
Book ended by 9/11 at the start, and a financial wipeout at the end, the first 10 years of this century will very likely go down as the most dispiriting and disillusioning decade Americans have lived through in the postWorld War II era Call it whatever you want just give thanks that it is ...over.
Noble Prize winning economist Paul Krugman had no problem at all coming up with a name for the decade. He called it The Big Zero.
In his New York Times column Krugman wrote: It was a decade in which nothing good happened, and none of the optimistic things we were supposed to believe turned out to be true.
He has his reasons for calling the past decade The Big Zero. He says it was a decade of:
- Zero job creation.
- Zero economic gains for the typical family.
- Zero gains for homeowners, even if they bought early. (Almost a quarter of all mortgages in America, and 45 percent of mortgages in Florida, are underwater, with owners owing more than their houses are worth.)
- Zero gains for stocks.
Krugman reminds readers of the excitement in 1999 when the Dow first topped 10,000. Summing up Krugman says:
So there was a whole lot of nothing going on in measures of economic progress or success So lets bid a not at all fond farewell to the Big Zero the decade in which we achieved nothing and learned nothing.
We are now poised at the beginning of a new year and a new decade. We can hope that the bad things that happened in the first decade were a coda to the previous century, and not an overture of whats to come. Today the US is cleaning up the mess from the largest financial collapse in history. There is no doubt, as we have written before, that the US will remain vulnerable to misgivings about its sovereign creditworthiness. This is especially so when you consider the high proportion of US debt held overseas.
What would we call this decade at Sunshine Profits? From our point of view its nothing short of the Golden Decade. It was surely golds turn to shine. A $100 investment in gold when the market opened on January 3, 2000, was worth about $380 as of the end of the decade, for a total return of 280 percent and an annualized return of 14.3 percent. Gold stocks (as measured by the XAU Index) have also had a good decade, climbing 9.4 percent annually.
For this coming year and perhaps even for this coming decade, we're betting on silver and gold, also in the form of mining stocks.
Moving on to the technical part of the commentary, this week I would like to provide you with analysis of gold and silver. Let's begin with the yellow metal (charts courtesy of http://stockcharts.com).
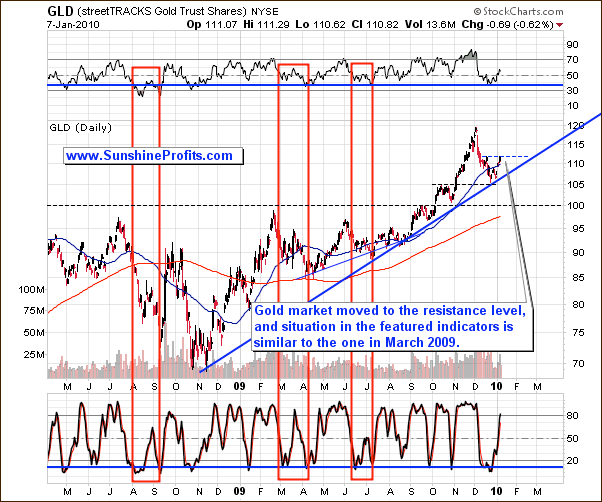
The price of gold moved higher this week, but it was stopped by the resistance level created by the small December top. The history suggests that the gold market often corrects in the form of a zigzag, and the one that we have seen so far is in my opinion too small to say that "that was it".
Please compare the December 2009 downswing to the similar moves in the past that I've marked with red rectangles. Each time correction had two stages, and even the smallest one (June-July 2009) had the biggest upswing within it, than what we've seen in the mid-December 2009. This alone suggests that the current move up is in fact an upswing within a move lower.
The current situation in the featured indicators: RSI and Stochastic, is also similar to the ones from the time frames marked with red rectangles, which serves as a confirmation of the above analysis.
Additional confirmation comes from the analysis of the white metal.
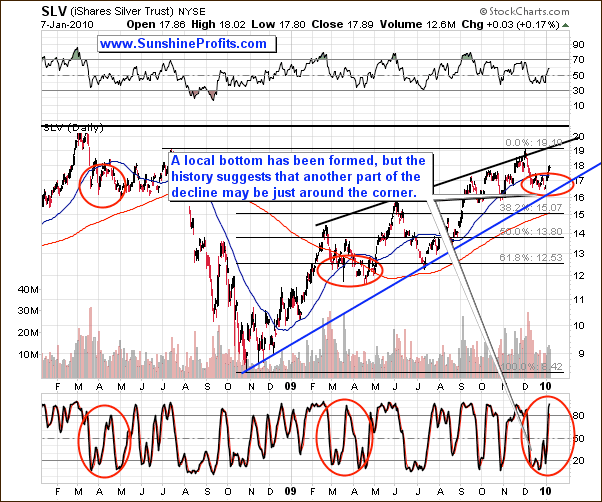
The situation on the silver market is also similar to the ones that already took place, also with similar implications to the ones mentioned earlier.
The tendency for the silver to correct in more than one stage is even stronger for the white metal than it is for the yellow one, especially after big upswings. This has a lot to do with the fact that silver is generally more volatile than gold, but I don't want to get into details of this mechanism in this particular essay. The point here is that what we've seen up to date is most likely just a first part of the decline. We doubt that the second part would take us much below the recent low, but it appears likely that it will take some time (a week or a few of them) before the final bottom for this decline is put.
Please take a look at the situation in the Stochastic indicator. During past corrections it formed some kind of double-bottom, after which it rallied to/above the 80 level only to correct soon after that. This is where we are today - at the moment Stochastic indicator has just moved above the 80 level. Should the history repeat itself once again, silver may move lower soon.
Summing up, it MAY be the case that the bottom is behind us and the risk being left behind is too big for one's long-term holdings - at least in our view. However, there are still several points that make this situation unclear in the short run. More details are available to Subscribers. It may be a good idea to subscribe now, because today's Premium Update includes rankings of the top gold/silver juniors (we've added 2 new stocks to our gold junior list and they are already on the first and third place).
To make sure that you are notified once the new features (like the newly introduced Free Charts section) are implemented, and get immediate access to my free thoughts on the market, including information not available publicly, I urge you to sign up for my free e-mail list. Sign up today and you'll also get free, 7-day access to the Premium Sections on my website, including valuable tools and charts dedicated to serious PM Investors and Speculators. It's free and you may unsubscribe at any time.
Thank you for reading. Have a great and profitable week!
P. Radomski
--
In this week's Premium Update we further elaborate on the situation on the gold and silver markets, with the emphasis on its current connection with the U.S. Dollar. The USD Index is currently one of the most important things to take into account while analyzing gold and silver market, and this update includes its detailed analysis (3 charts are dedicated to this key driver of PM prices).
Other things analyzed in this week's Update include: cyclical tendencies on the silver market, PM stocks, the relative performance of the latter to other stocks, the general stock market itself, and our exclusive correlations matrix.
In addition to the above, we feature rankings of top gold and silver juniors. Two gol.
We encourage you to Subscribe to the Premium Service today and read the full version of this week's analysis right away.
PS. There's one more thing that we'd like to comment on this week, and this is the usefulness of the technical analysis. Every now and then we encounter an essay, in which somebody elaborates on how the markets move totally randomly and that it's impossible to infer anything from the charts. Naturally, we respect these views, but we simply can't agree with them, and on the following two charts we would like to tell you why.
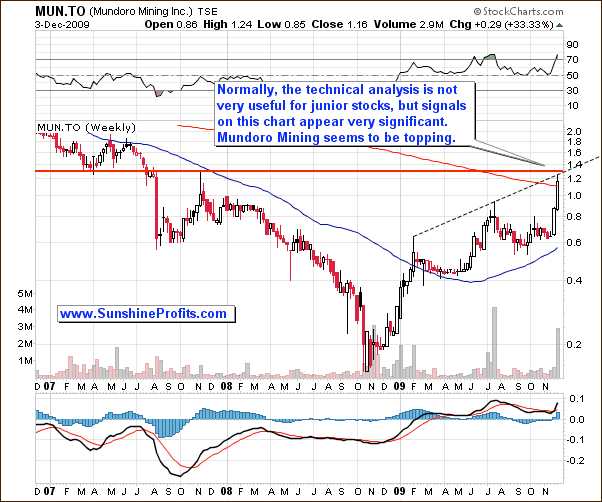
Over a month ago (in addition to posting the top gold/silver junior rankings, just like this week) we mentioned Mundoro Mining Inc. We wrote the following:
MUN.TO is currently reaching a critical resistance level at 1.3 CAD, which has been created by combining two very important resistance levels - the rising medium-term line, and the horizontal line that has already stopped a rally in MUN.TO in 2007. Consequently, it seems that rebalancing your long-term junior portfolio now would be a good idea. By that I mean selling a part of your MUN.TO holdings and use the proceeds to purchase other stocks from the list.
We supplemented the above analysis with the following chart:
Here's what happened since that time:
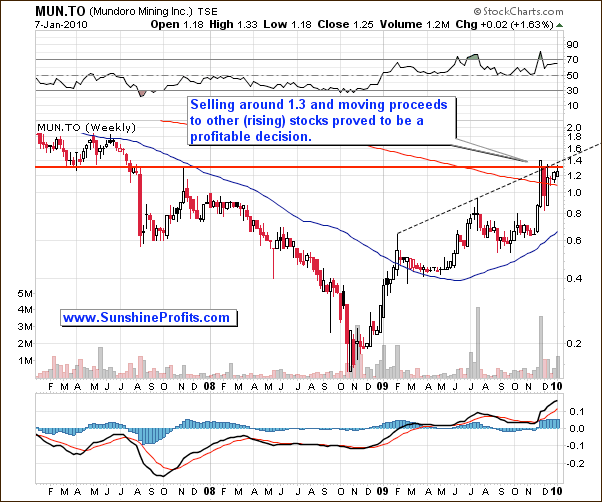
Stock closed the week at 1.4 CAD, which means that Subscribers, who decided to close/limit their position in MUN.TO were able to sell into strength and took the money off the table just before the price fell below 0.9 CAD. It seems that people saying that the technical analysis simply does not work would have a hard time denying its usefulness on the above charts, or convincing anyone who profited on this trade...
