
Based on the June 28th, 2013 Premium Update. Visit our archives for more gold & silver articles.
Without a doubt, this was a week of strong declines for the yellow metal. What could we read in newspapers and see on TV? The big banks were falling over each other in their scramble to get on the bear bandwagon. Here are some sample headlines:
Morgan Stanley to Goldman Cut Gold Forecasts on Fed Outlook
"'Paradigm shift' to send gold sliding to $1,200 an ounce: SocGen"
"Gold to Drop Even Further as Fed Increases Real Rates: Goldman Sachs"
"Deutsche Bank cuts gold, silver forecast for 2013"
"Credit Suisse cuts gold, silver, Brent forecasts"
Everybody is talking about the price of gold and wondering where the bottom is. Today in early Asian trade gold fell under $1,200 to its lowest level since 2010. This is down more than $200 an ounce since the beginning of last week and probably the yellow metal is on track to post its worst quarter since at least 1968.
"It's a long term bear market. If you bought into it today, don't expect it's going to do much. And if you own some and get a rally, get rid of it," said Dennis Gartman, editor of The Gartman Letter, a daily commentary on financial markets.
On the other hand we can read some more optimistic comments.
James Rickards, managing director at Tangent Capital expects China to start buying gold at these low levels, up to perhaps 4,000 tons. "People will say 'Why is China buying gold if it's so worthless?' " he said.
Who is wrong? Who is right? Would it be the metal's worst weekly performance since 1983? To see if this week holds any surprises for gold and the precious metals sector let's begin this week's technical part with the analysis of the US Dollar Index. We will start with the very long-term chart (charts courtesy by http://stockcharts.com.)
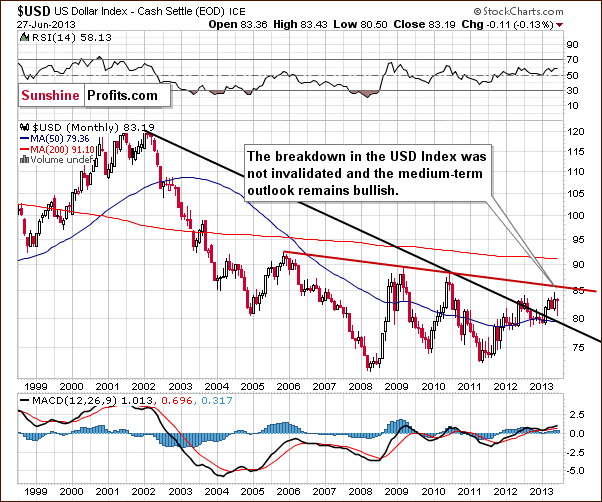
When we look at this chart, (recall that we have been expecting the index to move higher for some time now once the breakout was seen), we see that a rally finally materialized this week. This chart is still bullish at this time. There is a resistance level at 86.4, and also another one which corresponds to the previous high (seen this week) and that will be seen more clearly on the next chart.
Let's take a look at the medium-term situation.
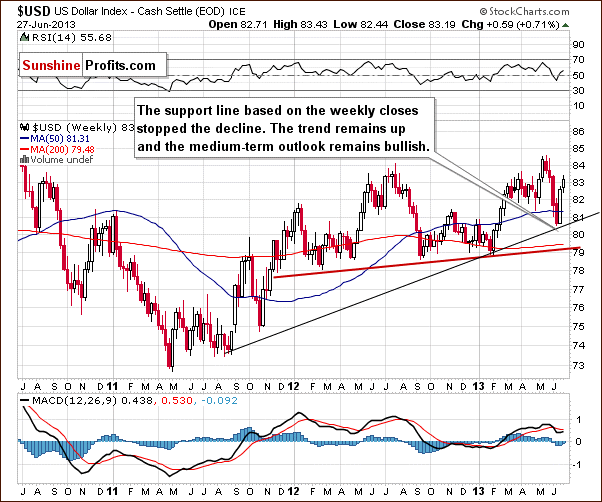
In this perspective we can see that the support line was reached and it held the decline, so the medium-term trend remains up. As mentioned above, there could be a pause around 84.5 or so, which is just one index point higher than the current level.
The situation remains bullish for the USD Index in the long and medium term, so let's check to see if the short-time outlook is the same.
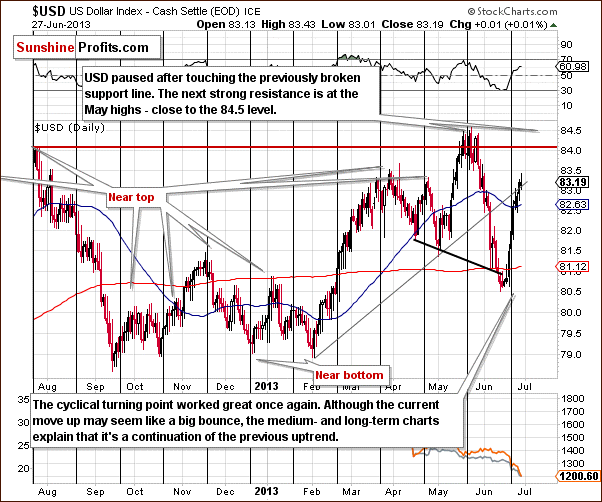
In this week's USD Index short-term chart, we can see how the situation has evolved recently. A sharp rally was seen recently so a pause would not be surprising. As odd as it may sound given the previous sentence, a continuation of the rally is also a possibility. The upswing is pretty symmetrical with the preceding decline, and if this continues, we could see a move above 84 in the coming days. This would likely have severe bearish implications for gold and silver. Taking a closer look, it seems that higher USD values in the past few days drove gold and silver prices lower, so a move above 84 would surely be a big deal for the whole precious metals sector.
Now let's move on to the analysis of the Euro Index.
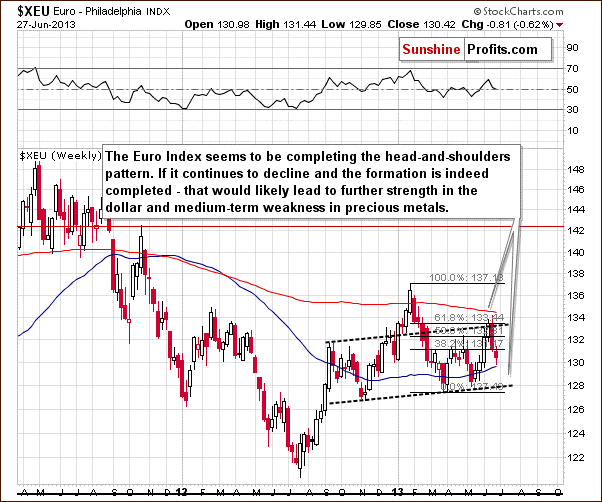
In this week's Euro Index chart, we see that the head-and-shoulders pattern remains in place. It has not yet completed (and it could still be invalidated) but it is still being formed. With the short-term trend down for the euro, this chart is bearish at this time for the medium term, so it confirms what we wrote about the USD Index, as the two indices move in the opposite directions as the EUR:USD currency exchange rate is the main part of the USD Index.
Our final chart looks at the price of the yellow metal from a non-USD perspective. We haven't commented on gold from this perspective for some time, so at the beginning let's remind what this rather unknown ratio actually is.
UDN is the symbol for the PowerShares DB US Dollar Index Bearish Fund, which moves in the exactly opposite direction to the USD Index. Since the USD Index is a weighted average of dollar's currency exchange rates with world's most important currencies, we may use the gold:UDN ratio to estimate the value of gold priced in "other currencies." What we feature on the chart below is not the price of gold in one particular currency. It is a weighted average price of gold that we calculate based on the price of gold in a number of currencies other than the US dollar.
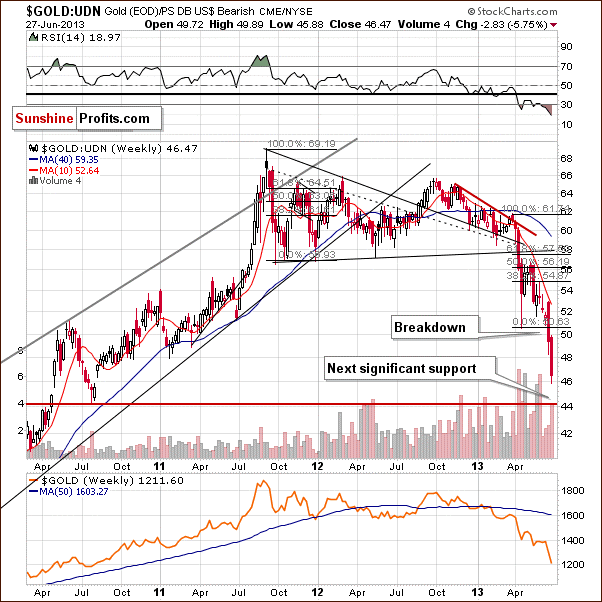
In this week's chart of gold from the non-USD perspective we see the yellow metal confirmed its breakdown and is declining just as is the case with gold seen from our regular USD perspective.
The technical situation on this chart is bearish. The next support level for gold priced in currencies other than the dollar is lower than gold is today, so there is still room for further decline in the coming days and weeks, even though gold rallied on Friday (at least in the first hours of the session).
Summing up, the long, medium, and short-term outlook for the USD remains bullish. Further moves to the upside seem probable sooner or later based on the long and medium-term trends. This has bearish implications for gold (and the precious metals sector) and suggests lower prices are on the horizon. Consequently, the final bottom for this decline seems not to be in just yet. At the same time please note that the local bottom may be relatively close or it is already in.
Earlier today we posted our weekly Premium Update with multiple important charts and soon after today's early rally in gold and silver we sent out a Market Alert with important information regarding our speculative positions. Please sign up to read it.
Thank you for reading. Have a great weekend and profitable week!
Sincerely,
Przemyslaw Radomski, CFA
