
Based on the May 6th, 2011 Premium Update. Visit our archives for more gold & silver articles.
Silver was one of the top priorities for many of precious metal traders until last week. However, silver market witnessed a dramatic turbulence in recent days. Lets examine what has happened in silver market, in detail. Two weeks of gains for silver were erased in only 11 minutes this Monday as markets opened for electronic trading in Asia with prices falling as much as 12 per cent in the session. Spot gold fell 2.2% in 40 minutes. On Wednesday prices took another hit on a newspaper report that high-profile investors, including George Soros hedge fund, have sold precious metals. Silver for July delivery closed lower by 7.5%, at $39.39 an ounce on the Comex division of the New York
A freefall situation! But, none of this caught our readers by surprise.
We warned on Friday that silver was vulnerable for a washout on the downside. We wrote: the situation in silver is extremely tense at this time. It seems that we are near an important top, although we may see higher prices for the next several days/weeks before it is reached. Most Traders should not attempt to take advantage of this rally, for it could be difficult to exit quickly if the situation becomes very volatile. Such will be the case if a multi-dollar decline is seen in silvers price right after the top is formed. Betting on higher silver prices should only capture the interest of the most risk tolerant of Speculators.
Much of the sell-off in silver was attributed to tougher margin requirements for speculative traders. The Comex had raised trading margins on silver contracts for the third time in two weeks. (CME Group Ltd., Comex's owner, said this week that the minimum amount of cash that must be deposited when borrowing from brokers to trade silver futures will rise to $16,200 per contract at the close of business yesterday, from $14,513. A year ago, the margin was $4,250.) There was also news that one of the biggest silver bulls in the world, Eric Sprott of Sprott Asset Management, had started selling 35 million shares of PSLV, a Sprott-owned silver ETF, but he later said that money raised from the sale will be reinvested into either silver or silver equities.
In any case, silver is well known for its volatility was overdue for some profit taking. Recently we wrote about the Hunt brothers of Texas who tried to corner the market in silver in the 1970s. Back then, after futures rallied to a record $50.35 an ounce in January 1980, prices dropped 78 percent in four months. In the spring of 2006, silver took a parabolic run to hit the price of $15 in May. Six weeks later the price had fallen by more than 35%, to trade around $9.50. In March 2008, silver made it almost to $22. Eight months later it was below $9.
Overall, silver has gained more than 145 per cent in the past year, and 19 per cent in April alone. Unlike gold, which is bought and held by large investors, funds and central banks, silver is dominated by individual investors who can better fit in this small market.
With all the turbulence in precious metals, and as we slowly enter the summer which is considered a seasonally weak time for precious metals, lets turn to the technical portion. We will start with the very long-term silver chart (charts courtesy by http://stockcharts.com.)
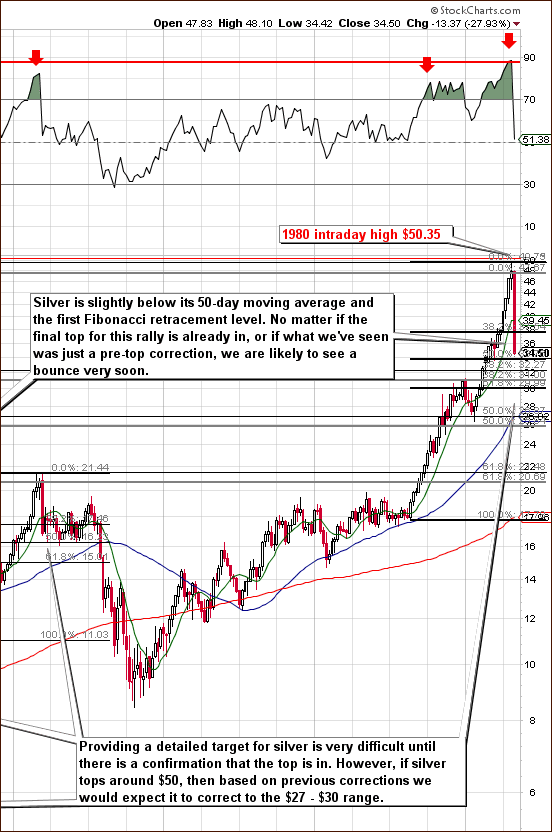
Extraordinary declines in the price of silver are clearly visible even in the very long-term chart. Being long silver was quite painful and certainly was worse than what was felt by those holding gold. Silver does appear at this time to be close to a local bottom though not necessarily its final bottom.
Lets compare this correction to the once seen in 2006. At that time, silver declined to its first Fibonacci retracement level and below its 50-day moving average. Generally speaking, silver is below the 38.2% retracement level however it might be the case that given the previous volatility to the upside, the move to the downside will be more volatile as well.
Perhaps those who purchased silver at the top in 1980 have recently finally exited the market and contributed to the rapidness of the recent price decline. RSI levels indicate the possibility that we may be at the beginning of a major correction. Once again however, we note the volatility of the white metal and we venture to say that it seems theres a 40 to 45 percent chance that this rally will actually continue and silver will see new highs.
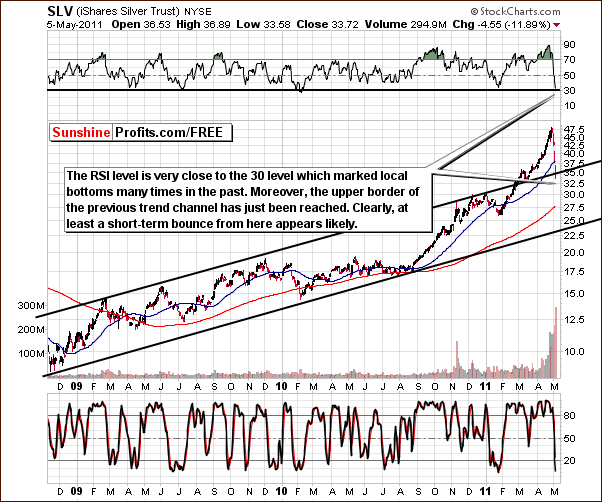
Moving on, lets look at the long-term silver chart. The 38.2% Fibonacci retracement level previously stopped declines in 2006 and 2008. This at least leaves open the possibility that a short-term bounce from here may be likely. Silvers behavior during such a bounce could provide additional details as to what will likely follow. This short-term bounce is likely to begin soon regardless of whether we are currently seeing a small correction or the beginning of a bigger one.
Zooming in for a closer look at silvers long-term trends, we see a move below an important support line created by the local tops of previous years. The RSI level is equal to that seen in prior local bottoms and its likely that a local bottom is very close at hand.
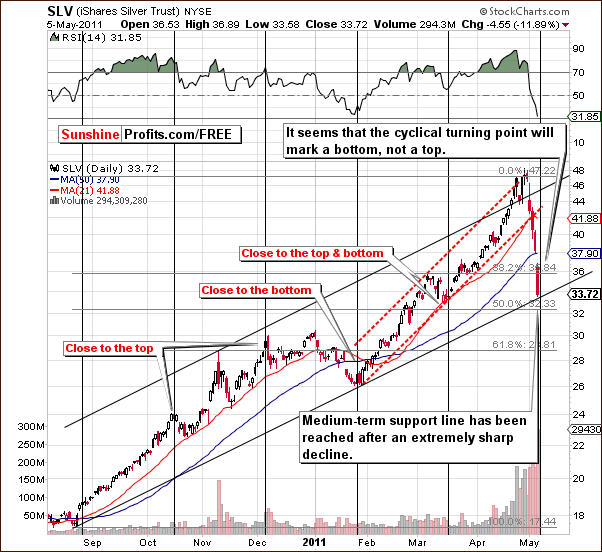
The short-term picture provides additional details. With silvers price very close to its short-term support line, a short-term bounce is very likely at this time. Furthermore, the white metal is currently right at a cyclical turning point which at the current market juncture appears to be a local bottom.
Before summarizing, lets see where the ratio between gold and silver stands.
The gold/silver ratio has clearly departed from its historical average. Even at its current, post-slip 40 times, it is a long way from the average of 62 over the decade ending in 2010. Silver's rally also started after the rally in gold, suggesting that investors locked in prior gold gains and then pushed into silver's smaller market.
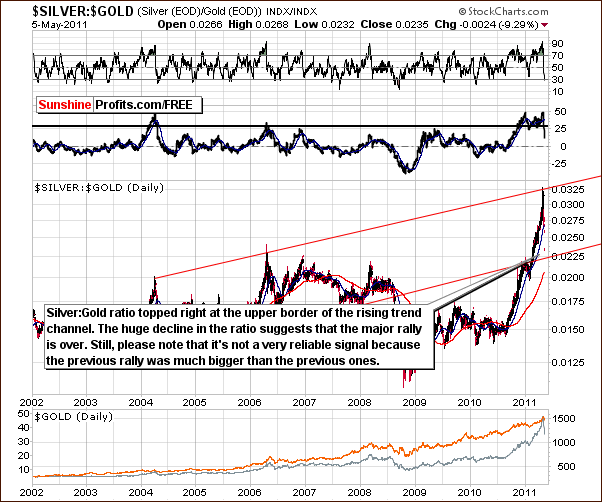
On the above chart, we see that the silver:gold ratio has topped out at the upper border of the rising trend channel. The decline and its size suggest that we have just seen a major top. The size of silvers recent rally however has been unprecedented and therefore comparing this to previous rallies is not all that meaningful. The final top may not yet be in and with a bounce likely, the question remains whether the major top has truly been seen. Still, this particular chart confirms this theory.
Summing up, what we have seen recently was probably (slightly more probable than not) a major top for the previous rally. However, regardless of this being true or not, a short-term rally from here appears likely. Naturally, if the final top is not yet in, then the rally will take silver much higher.
To make sure that you are notified once the new features are implemented, and get immediate access to my free thoughts on the market, including information not available publicly, we urge you to sign up for our free e-mail list. Sign up for our gold & silver mailing list today and you'll also get free, 7-day access to the Premium Sections on my website, including valuable tools and charts dedicated to serious PM Investors and Speculators. It's free and you may unsubscribe at any time.
Thank you for reading. Have a great weekend and profitable week!
P. Radomski
--
Has the USD really bottomed? Had Euro truly topped? These are important questions (especially for Gold and Silver Investors) that we deal with in today's update. Another thing that we comment on is the current situation in the general stock market and how it relates to the next steps in the PM sector. The analysis of multiple sectors will be important in the coming days as the medium-term situation is cloudy.
The good news is that short-term picture appears much clearer than the medium-term one, and in today's update we're providing several important details such as target for the correction in silver. Two of our indicators have just flashed signals and we believe they should be followed.
Additionally, the latest report includes our top gold & silver junior rankings along with the analysis of the SP Long-term Junior Indicator and the GDXJ:GDX ratio, which serves as a proxy for junior's outperformance relative to senior miners. We encourage you to Subscribe to the Premium Service today and read the full version of this week's analysis right away.
