
Forex Trading Alert originally sent to subscribers on May 8, 2014, 4:20 PM.
Earlier today, the euro moved higher after the European Central Bank left its benchmark interest rate unchanged at the record low of 0.25%. However, an acceleration of the rally came after U.S. Department of Labor showed that initial claims for jobless benefits in the week ending May 3 fell more than expected. Thanks to these disappointing numbers, EUR/USD hit a fresh 2014 high and approached the key level of 1.4000. Despite this improvement, the exchange rate reversed quickly and declined, erasing all earlier gains. Does this sharp drop suggest that the uptrend might be over?
In our opinion the following forex trading positions are justified - summary:
- EUR/USD: short (stop-loss order: 1.4040)
- GBP/USD: none
- USD/JPY: none
- USD/CAD: none
- USD/CHF: none
- AUD/USD: short (stop-loss order: 0.9410; initial price target: 0.9060)
AUD/USD
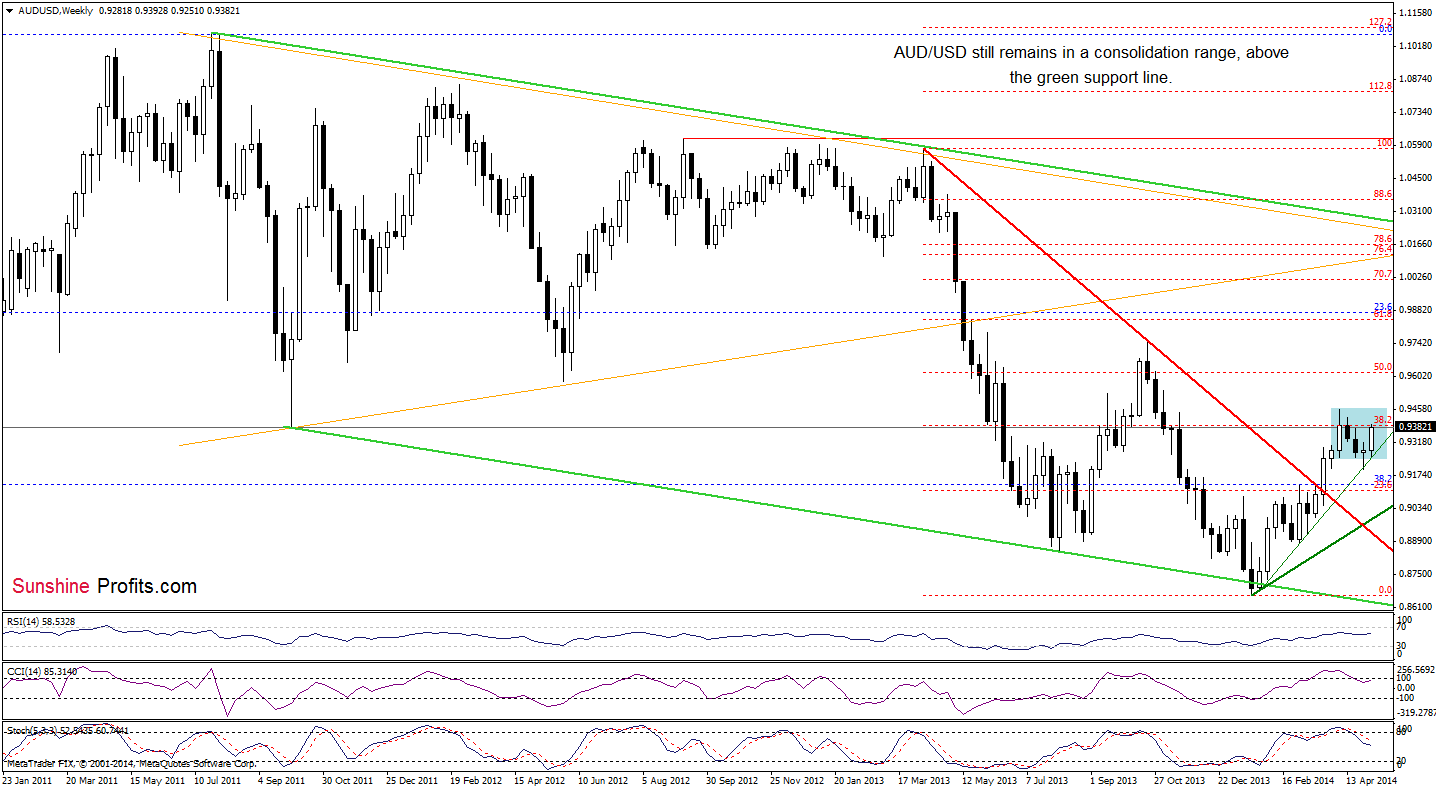
The overall situation in the medium term hasn’t changed much as the exchange rate still remains in the consolidation range. Although AUD/USD extended gains, from this perspective, we see that the pair reached the previously-broken 38.2% Fibonacci retracement (based on the entire Apr.-Jan. declines), which serves as resistance. If it holds, we will likely see a pullback and the downside target will be the green support line (which corresponds to the lower corder of the consolidation at the moment). On the other hand, if we see a breakout above the nearest resistance level, AUD/USD will likely climb to the April high. In our opinion, the first scenario is more likele as sell signals generated by the CCI and Stochastic Oscillator remain in place.
Once we know the above, let’s focus on changes in the short term.
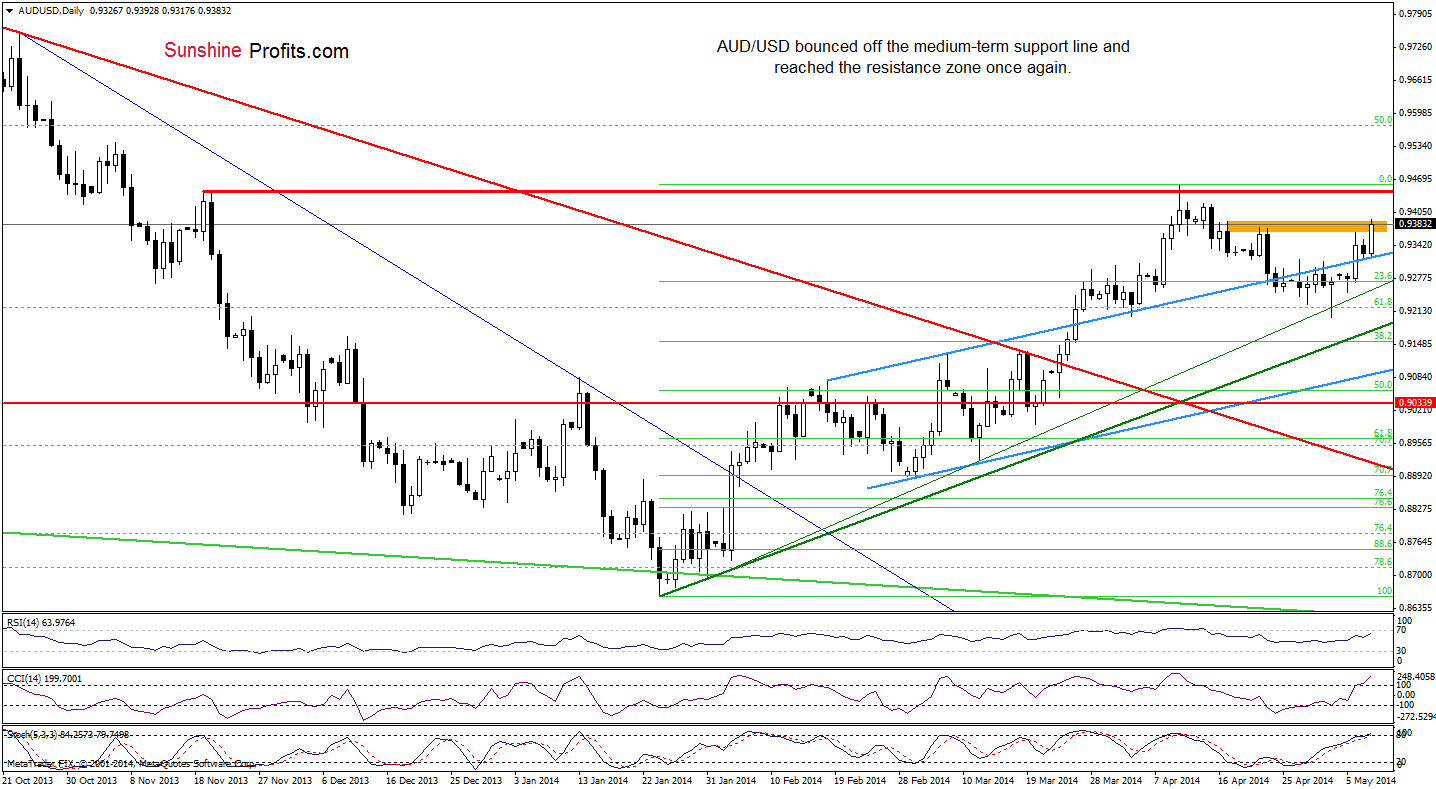
Yesterday, we wrote the following:
(…) AUD/USD moved lower and dropped to the previously-broken blue support/resistance line. If it holds, we may see another increase to the resistance zone created by the Apr. 17 and Apr. 22 highs.
Earlier today, we noticed such price action as the exchange rate bounced off the medium-term support line which triggered a sharp rally to the upside target. Despite this improvement, the resistance zone still holds (and is reinforced by the 38.2% Fibonacci retracement based on the entire Apr.-Jan. declines). Taking fact into account and combining it with the current position of the indicators (the CCI and Stochastic Oscillator are overbought), we think that another drop to the blue support line is likely to be seen. Please note that the bearish scenario will be more likely if the indicators generate sell signals.
Very short-term outlook: bearish
Short-term outlook: bearish
MT outlook: bearish
LT outlook: bearish
Trading position (short-term): Short. Stop-loss order: 0.9410 and initial price target: the lower border of the blue rising trend channel (currently at 0.9060). We will keep you informed should anything change, or should we see a confirmation/invalidation of the above.
EUR/USD
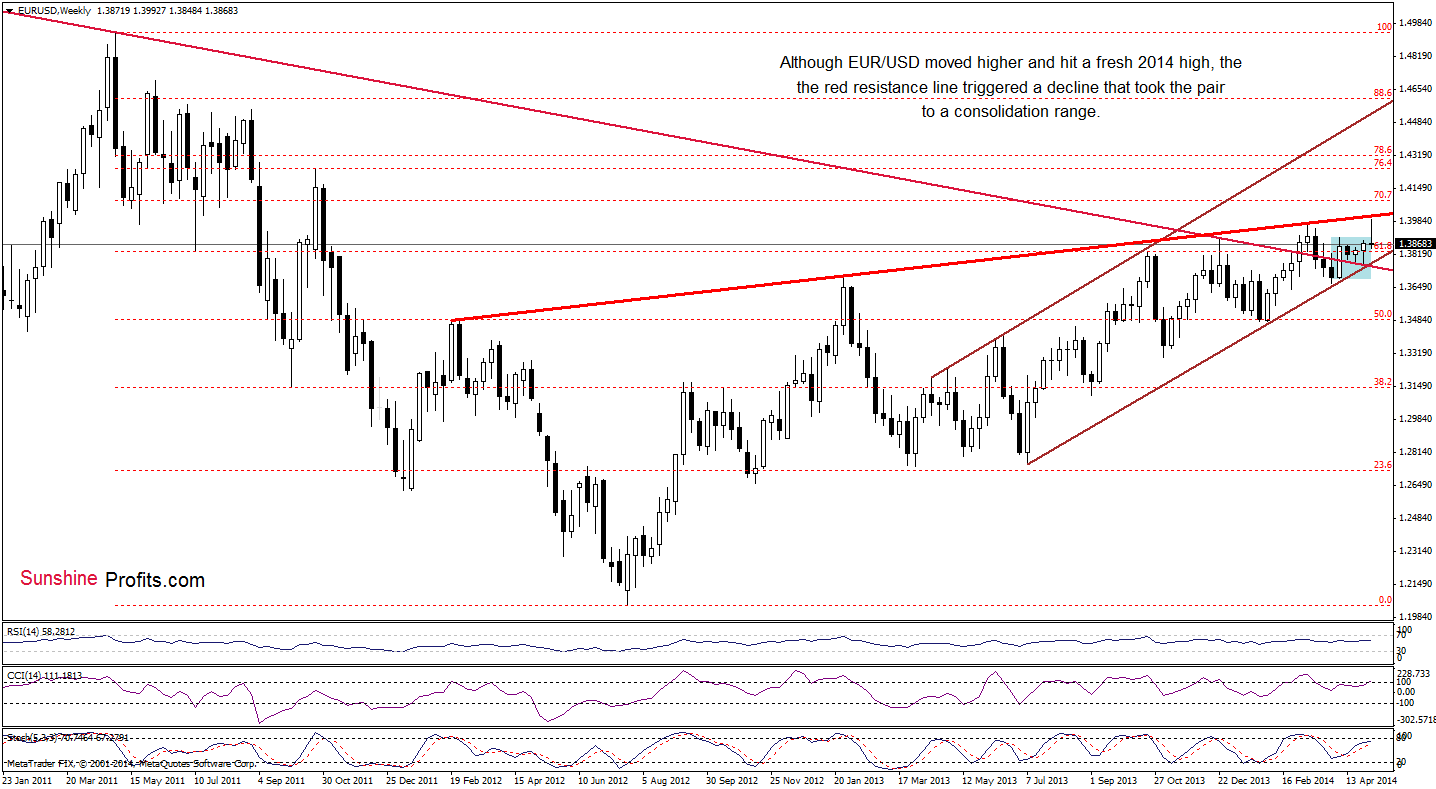
Quoting our last Forex Trading Alert:
(…) the pair moved higher, broke above the upper line of the consolidation and reached the first upside target. The breakout by itself is a strong bullish signal that may trigger further rally to the annual high or even to the red resistance line (currently around 1.4017).
As you see on the above chart, EUR/USD extended gains and realized the above-mentioned scenario, hitting a fresh 2014 high and approaching the red resistance line. Despite these positive circumstances, the exchange rate didn’t managed to hold gained levels. The strong resistance line in combination with the psychological barrier of 1.4000 triggered a sharp decline that took the pair to the consolidation range. In this way, a breakout above the previous high was invalidated, which is a strong bearish signal that suggests that further deterioration is just around the corner.
Will the sort-term picture give us any additional clues about future moves? Let’s find out.
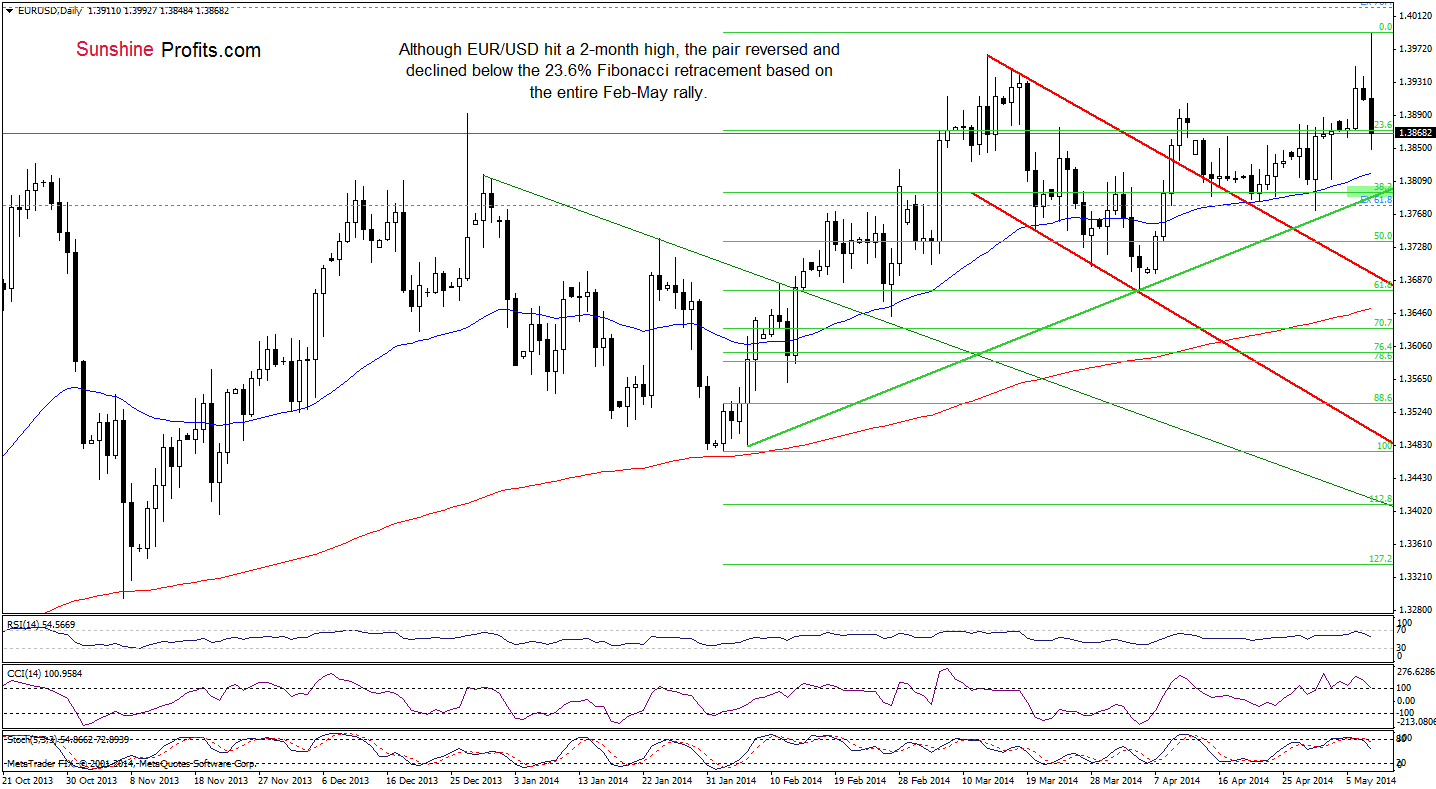
In our yesterday’s Forex Trading Alert, we wrote the following:
(…) Although the indicators didn’t give us precisely clues about the recent price moves, we clearly see that they are overbought. (…) the RSI increased to its highest level since March. Additionally, there is a small negative divergence between the CCI and the exchange rate, while the Stochastic Oscillator remains at levels that preceded downward moves in March and also in April. All the above provide us with bearish implications and suggests that correction is just around the corner.
As you see on the daily chart, the EUR/USD successfully broke above the previous 2014 high and reached the resistance zone created by the long-term red resistance line and the psychological level of 1.4000. In reaction to these circumstances, forex traders pushed the sell button, which triggered a sharp decline below the 23.6% Fibonacci retracement based on the entire Feb.-May rally. The pair erased all this week’s gains and is on a path to the 50-day moving average. If this is the case, this support line may stop further declines (similarly to what we saw in the recent two weeks). However, we think that in the current circumstances, it is doubtful that EUR/USD will rebound once again. In our opinion, the downside target, which may decelerate further deterioration will be around 1.3800 where the 38.2% Fibonacci retracement and the medium-term support line are.
Very short-term outlook: bearish
Short-term outlook: bearish
MT outlook: bearish
LT outlook: bearish
Trading position (short-term): In our opinion, opening short positions at the following terms is a good idea. Stop-loss order: 1.4040. We will keep you informed should anything change as far as our opinion is concerned, or should we see a confirmation/invalidation of the above. The above is not an investment / trading advice and please note that trading (especially using leveraged instruments such as futures or on the forex market) involves risk.
Thank you.
Nadia Simmons
Forex & Oil Trading Strategist
Przemyslaw Radomski, CFA
Founder, Editor-in-chief
Gold & Silver Trading Alerts
Forex Trading Alerts
Oil Investment Updates
Oil Trading Alerts
