

Forex Trading Alert originally sent to subscribers on June 14, 2016, 8:51 AM.
Earlier today, official data showed that U.K. inflation remained steady in the previous month, missing analysts’ forecasts for an increase of 0.4%. Additionally, uncertainty around the June 23 Brexit vote continued to weigh, which pushed GBP/USD under 1.4200 once again. How low could the pair go in the coming days?
In our opinion the following forex trading positions are justified - summary:
- EUR/USD: none
- GBP/USD: short (stop-loss order at 1.4785; initial downside target at 1.4056)
- USD/JPY: none
- USD/CAD: none
- USD/CHF: none
- AUD/USD: none
EUR/USD
On Monday, we wrote the following:
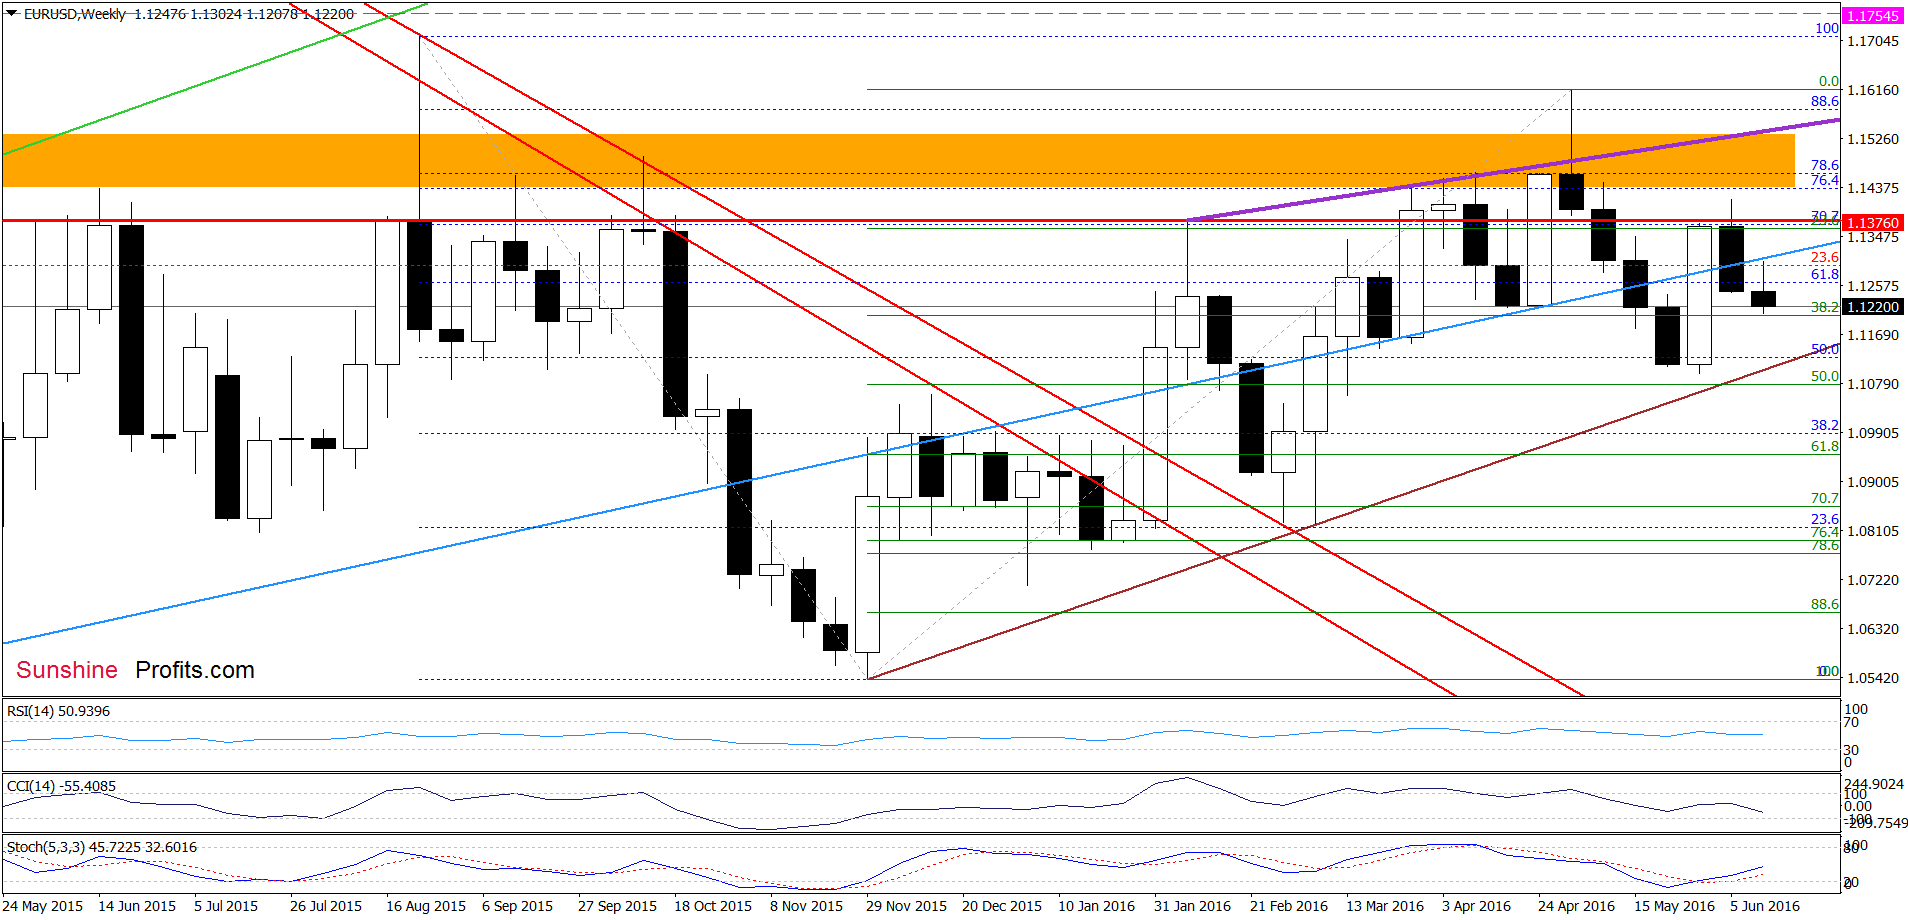
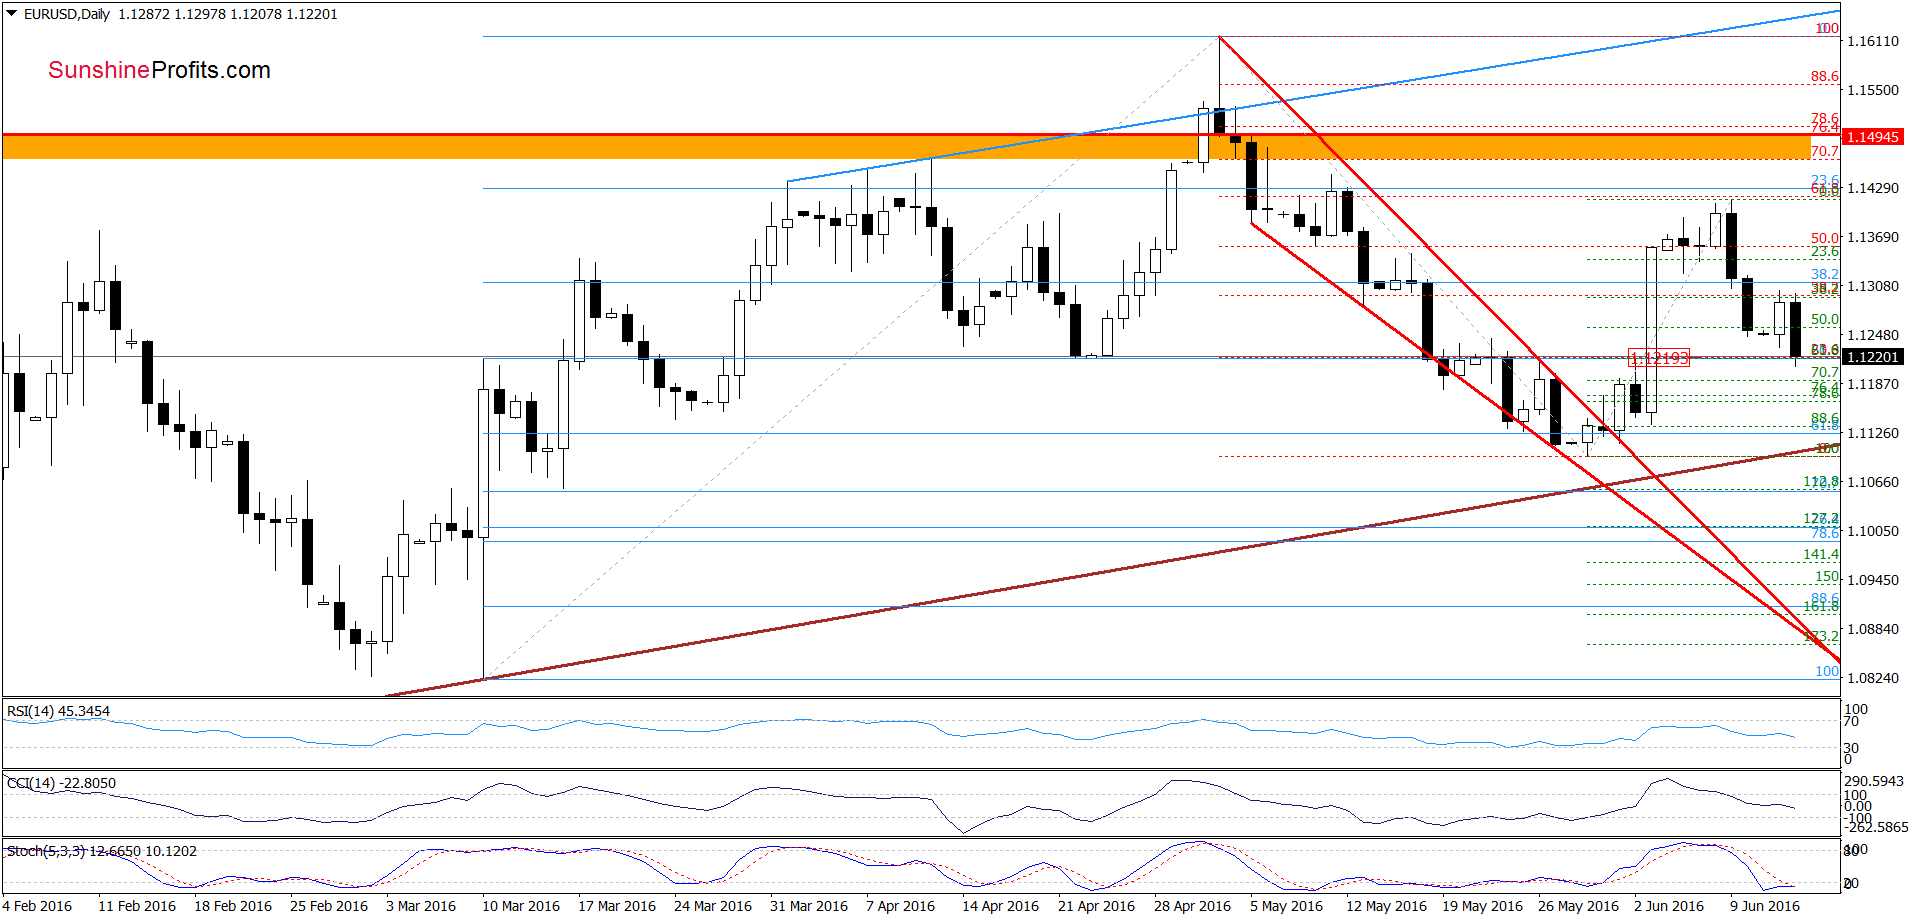
(…) sell signals generated by the indicators remain in place, suggesting another attempt to move lower. If this is the case, we’ll likely see a decline to around 1.1219, where the 61.8% retracement (based on the May 30 – Jun 9 upward move) and the Jun 2 high are.
Very short-term outlook: bearish
Short-term outlook: bearish
MT outlook: mixed with bearish bias
LT outlook: mixed
From today’s point of view, we see that the situation developed in line with the above scenario and EUR/USD reached our initial downside target earlier today. What’s next? Although the Stochastic Oscillator is overbought, we think that as long as there won’t be buy signals generated by the indicators another downswing is likely. If this is the case, and the pair slips below current levels, our next downside target from yesterday’s alert would be in play:
(…) If this area is broken, the next target would be the brown rising support line based on the Dec and Mar lows.
GBP/USD
Quoting our last commentary on this currency pair:
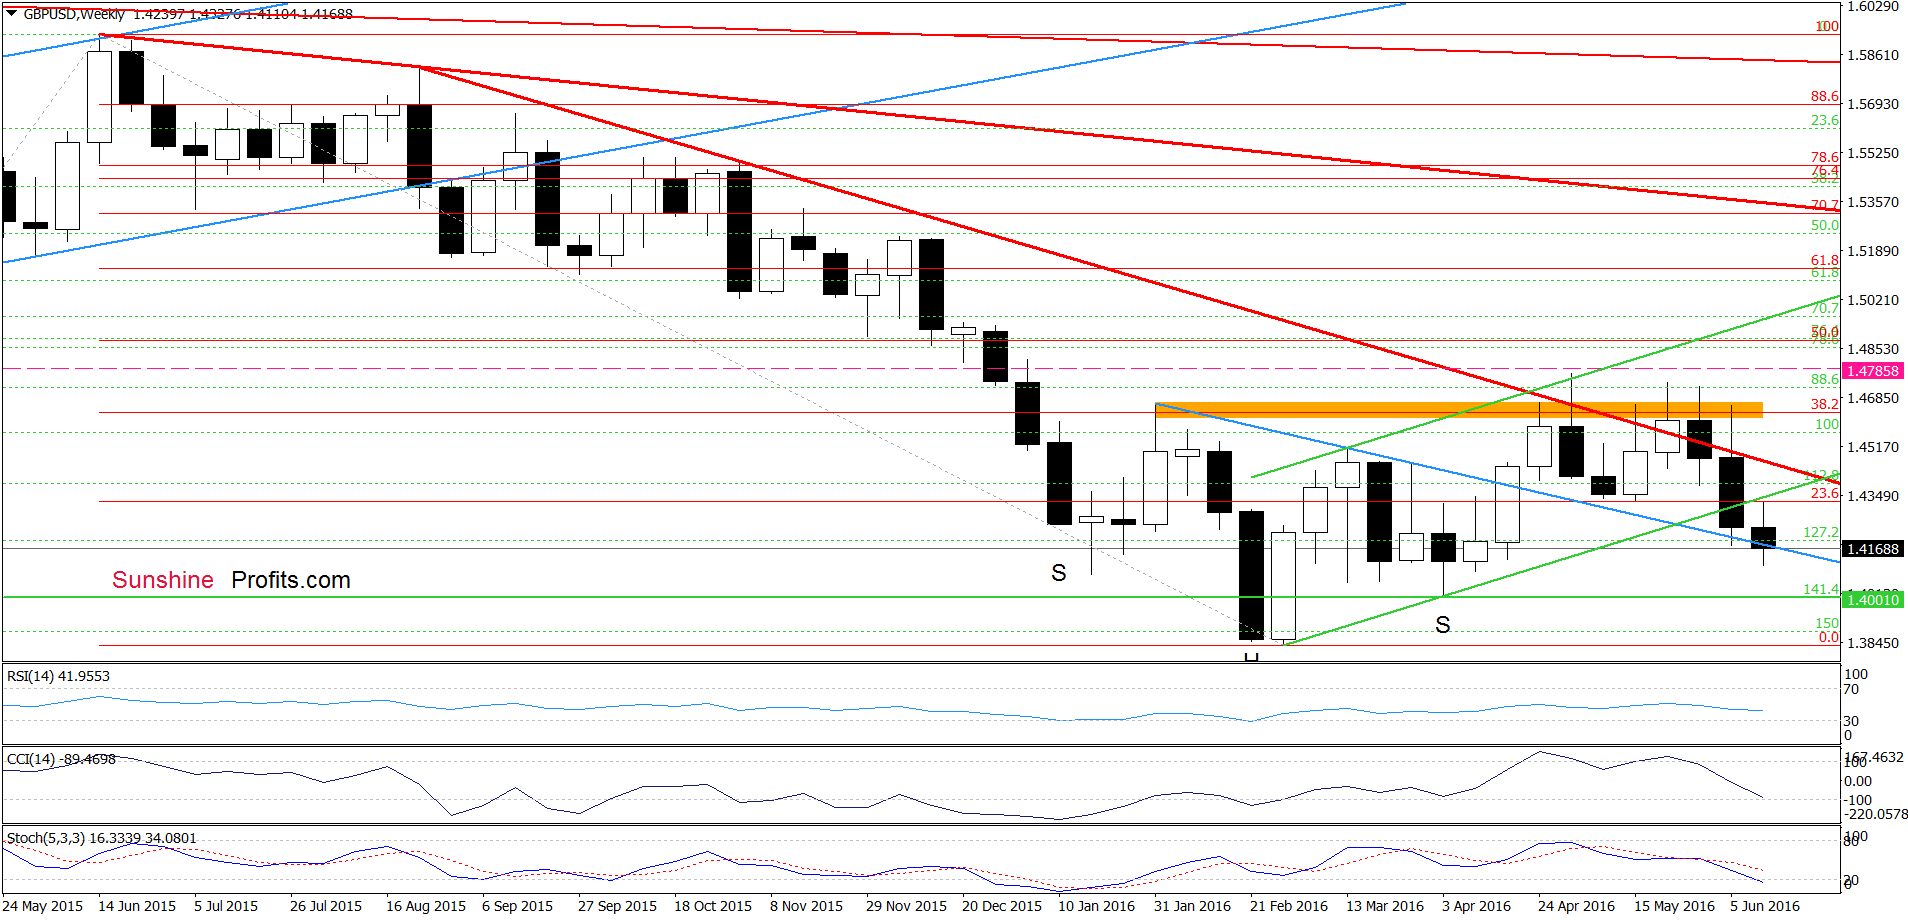
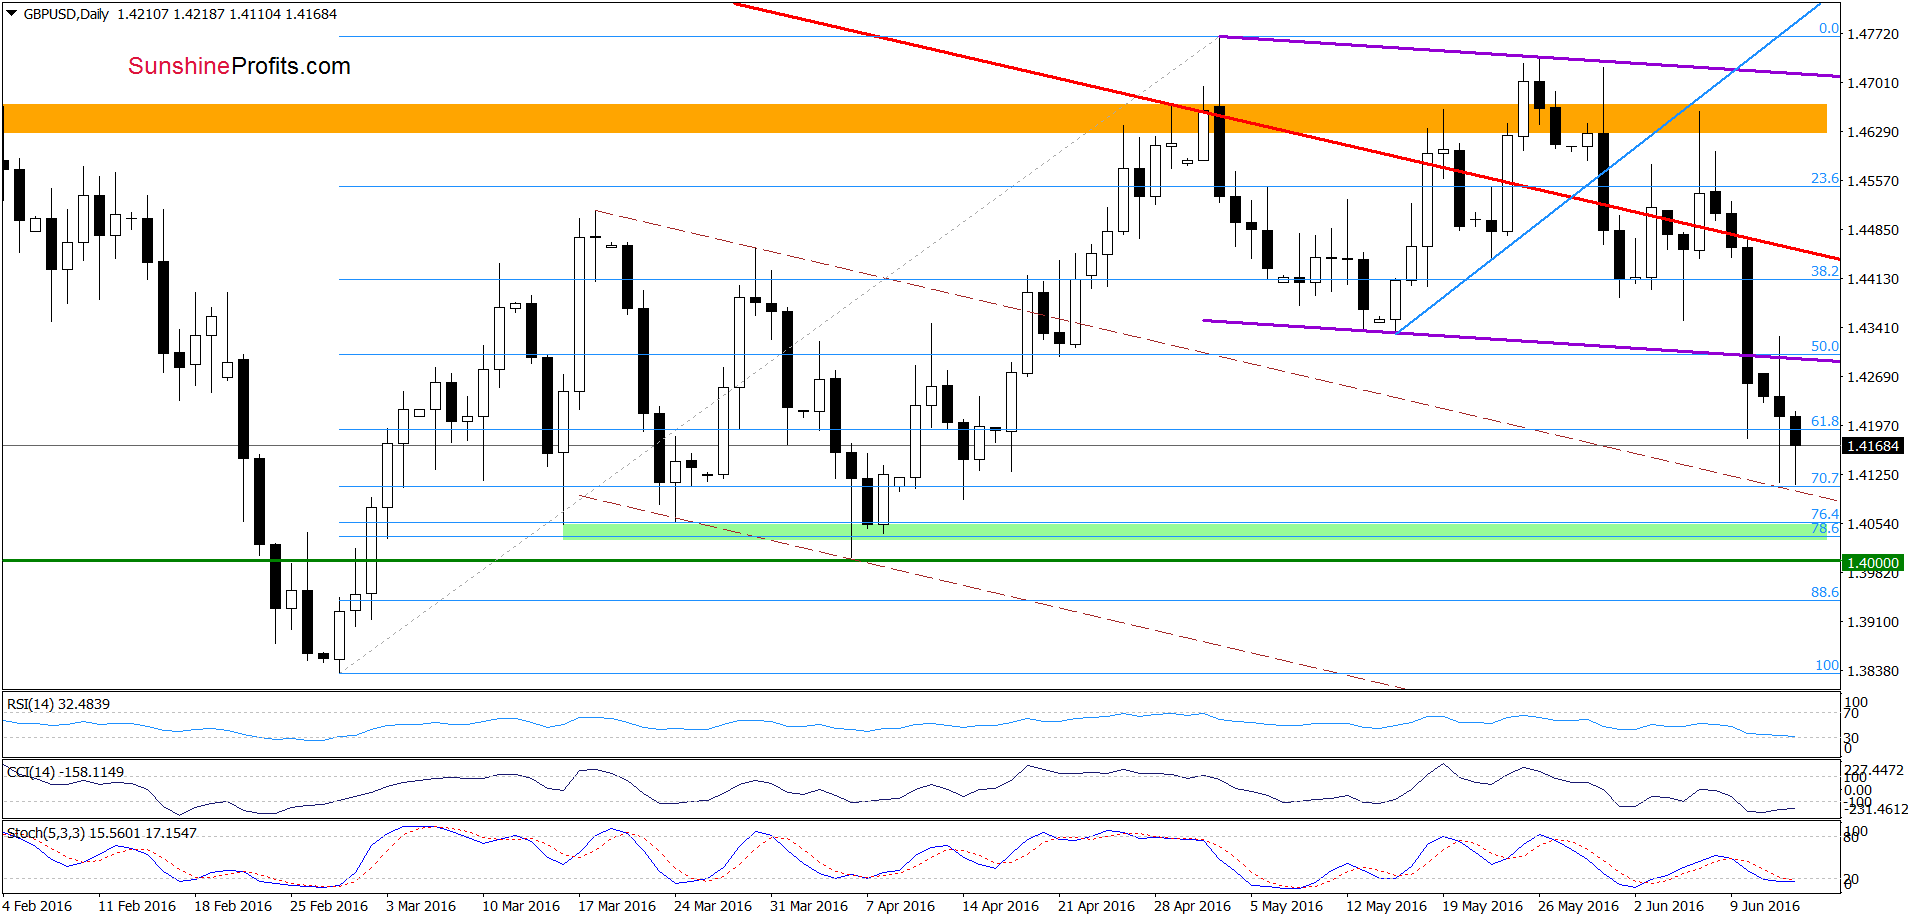
(…) the exchange rate dropped below the blue support line (seen on the weekly chart) and reached the brown dashed declining line (marked on the daily chart), which triggered a rebound in the following hours. Despite this move, sell signals generated by the indicators still support currency bears and the pair remains under the lower border of the purple declining trend channel, which suggests another attempt to move lower
Looking at the charts, we see that although GBP/USD moved higher yesterday, this upswing was a verification of earlier breakdown under the lower border of the purple declining trend channel. This negative signal encouraged currency bears to act (as we had expected), which resulted in a re-test of the brown dashed declining line (marked on the daily chart). Although this support line triggered a rebound earlier today, sell signals are still in play, supporting further deterioration. Taking this fact into account (and a drop under the blue support line (seen on the weekly chart), we think that the exchange rate will test the green support zone (created by the 76.4% and 78.6% Fibonacci retracement levels) in the coming days.
Very short-term outlook: bearish
Short-term outlook: bearish
MT outlook: mixed with bearish bias
LT outlook: mixed
Trading position (short-term; our opinion): Short positions (with a stop-loss order at 1.4785 and initial downside target at 1.4056), which are already profitable are justified from the risk/reward perspective at the moment. We will keep you informed should anything change, or should we see a confirmation/invalidation of the above.
AUD/USD
Quoting our yesterday’s commentary on this currency pair:
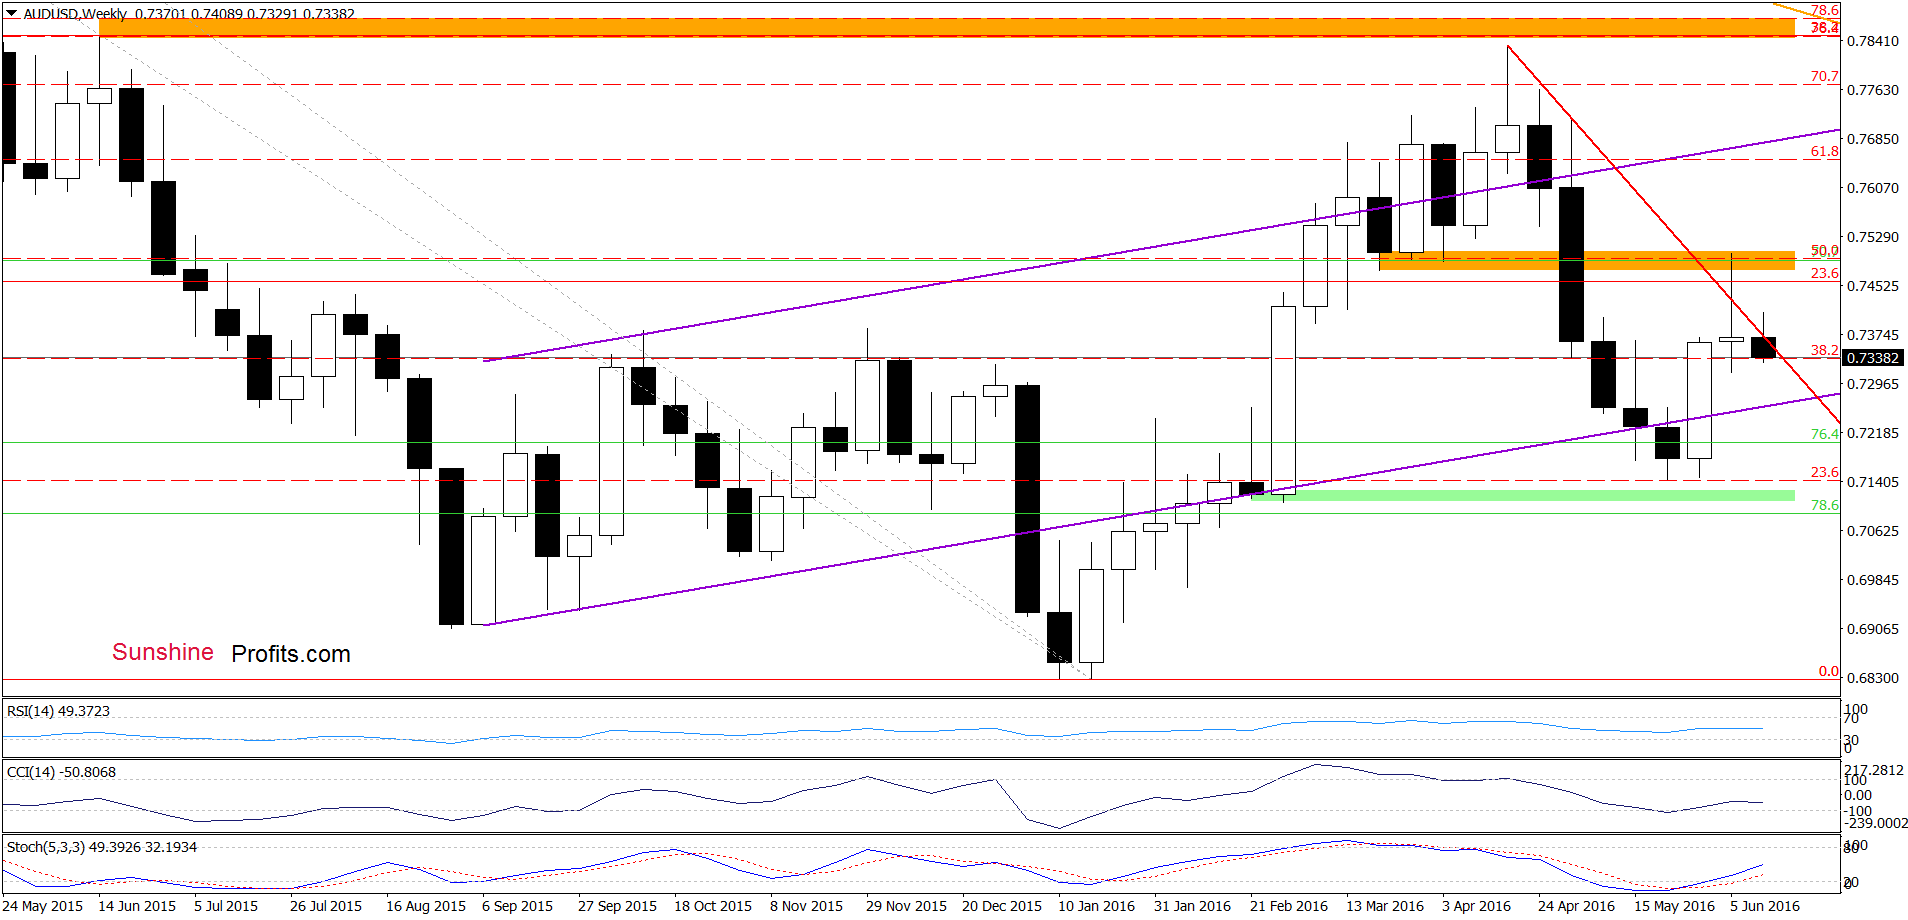
The first thing that catches the eye on the weekly chart is a comeback above the red declining resistance line, which in combination with buy signals generated by the indicators, suggests further improvement in the coming days. Nevertheless, such price action would be more likely and reliable if the pair closes this week above this line. Until this time, another downswing can’t be ruled out.
As you see on the chart, the situation developed in tune with the above scenario and AUD/USD moved lower earlier today. With this downswing, the pair slipped under the red declining line, invalidating earlier breakout. In our opinion, this is a negative signal that suggests further deterioration. How low could the pair go in the coming days? We think that the best answer to this question would be the quote from yesterday’s alert:
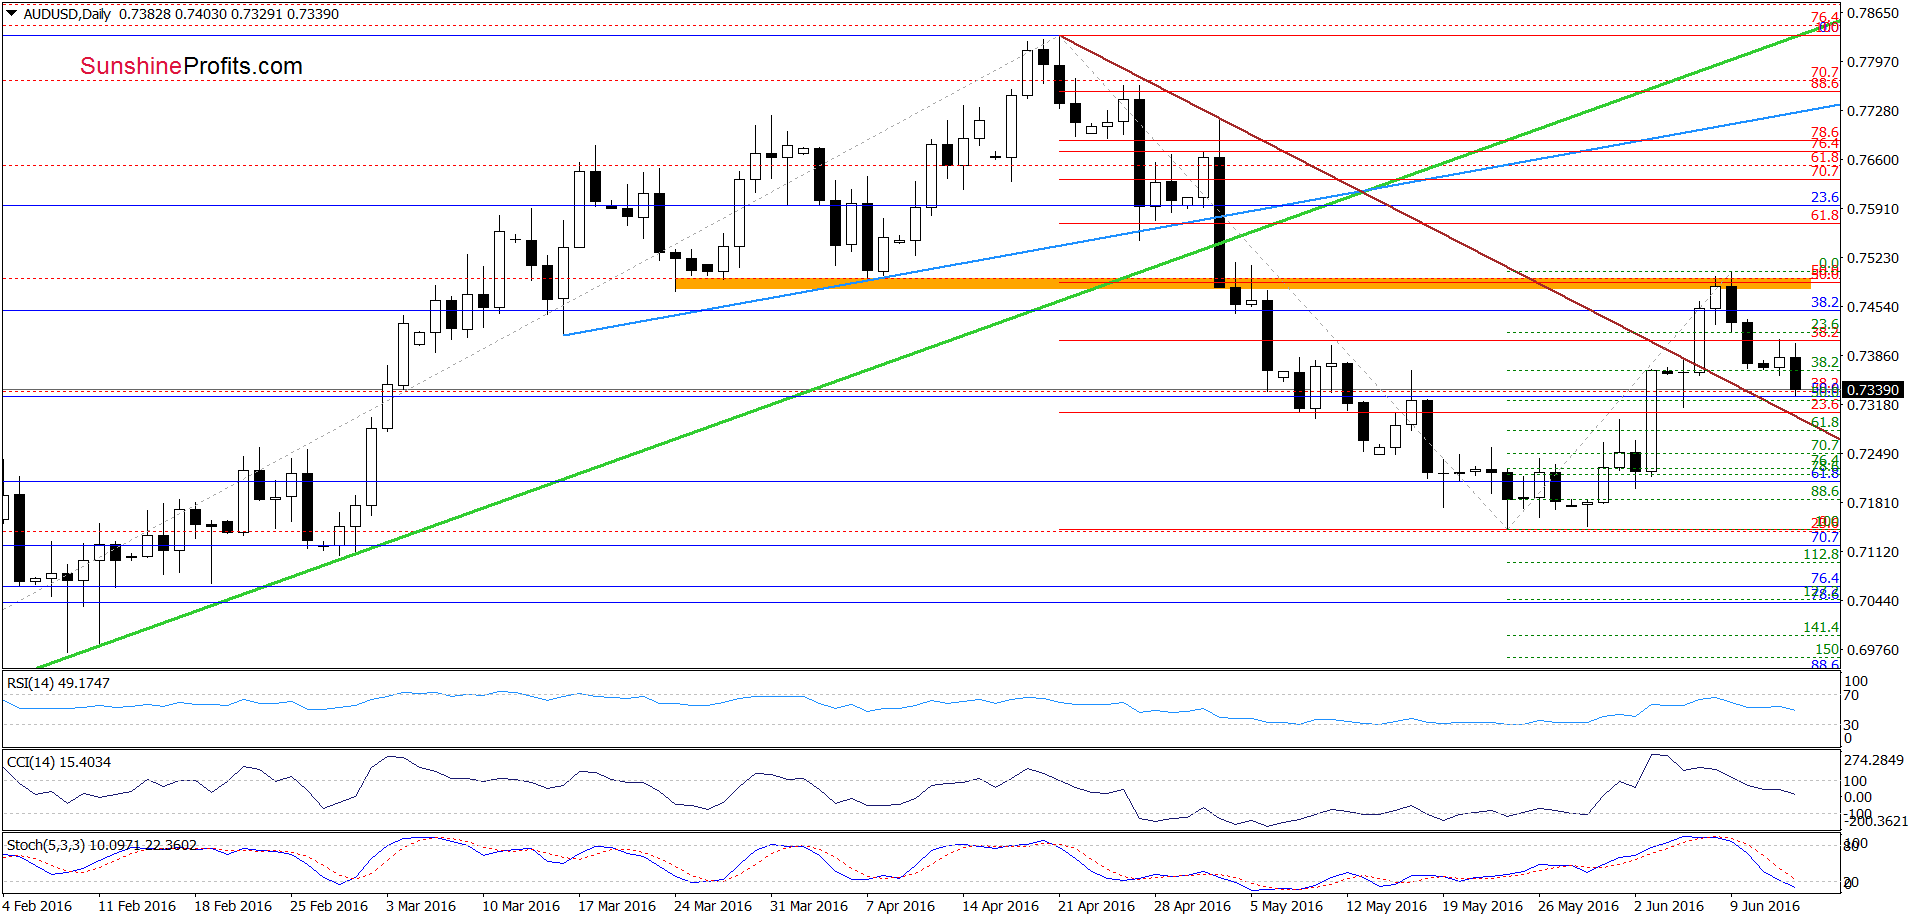
(…) we should keep in mind that sell signals are still in play, which suggests that another attempt to move lower is likely. If this is the case, the initial downside target would be the brown declining line, which serves now as the nearest support.
Very short-term outlook: mixed with bearish bias
Short-term outlook: mixed
MT outlook: mixed
LT outlook: mixed
Trading position (short-term; our opinion): No positions are justified from the risk/reward perspective. We will keep you informed should anything change, or should we see a confirmation/invalidation of the above.
Thank you.
Nadia Simmons
Forex & Oil Trading Strategist
Przemyslaw Radomski, CFA
Founder, Editor-in-chief
Gold & Silver Trading Alerts
Forex Trading Alerts
Oil Investment Updates
Oil Trading Alerts
