
The U.S. dollar has improved versus major currencies with the focus on whether U.S. data later in the day will support the case for the Federal Reserve’s gradually scaling back its bond-buying stimulus. Did this change the outlook for the five currency pairs? If you want to know our take on this question, we invite you to read our today's Forex Trading Alert.
Forex Trading Positions - Summary:
- EUR/USD: none
- GBP/USD: none
- USD/JPY: none
- USD/CAD: none
- USD/CHF: none
Details:
Let’s start with the daily chart of the EUR/USD pair.
Quoting our Forex Trading Alert from Monday:
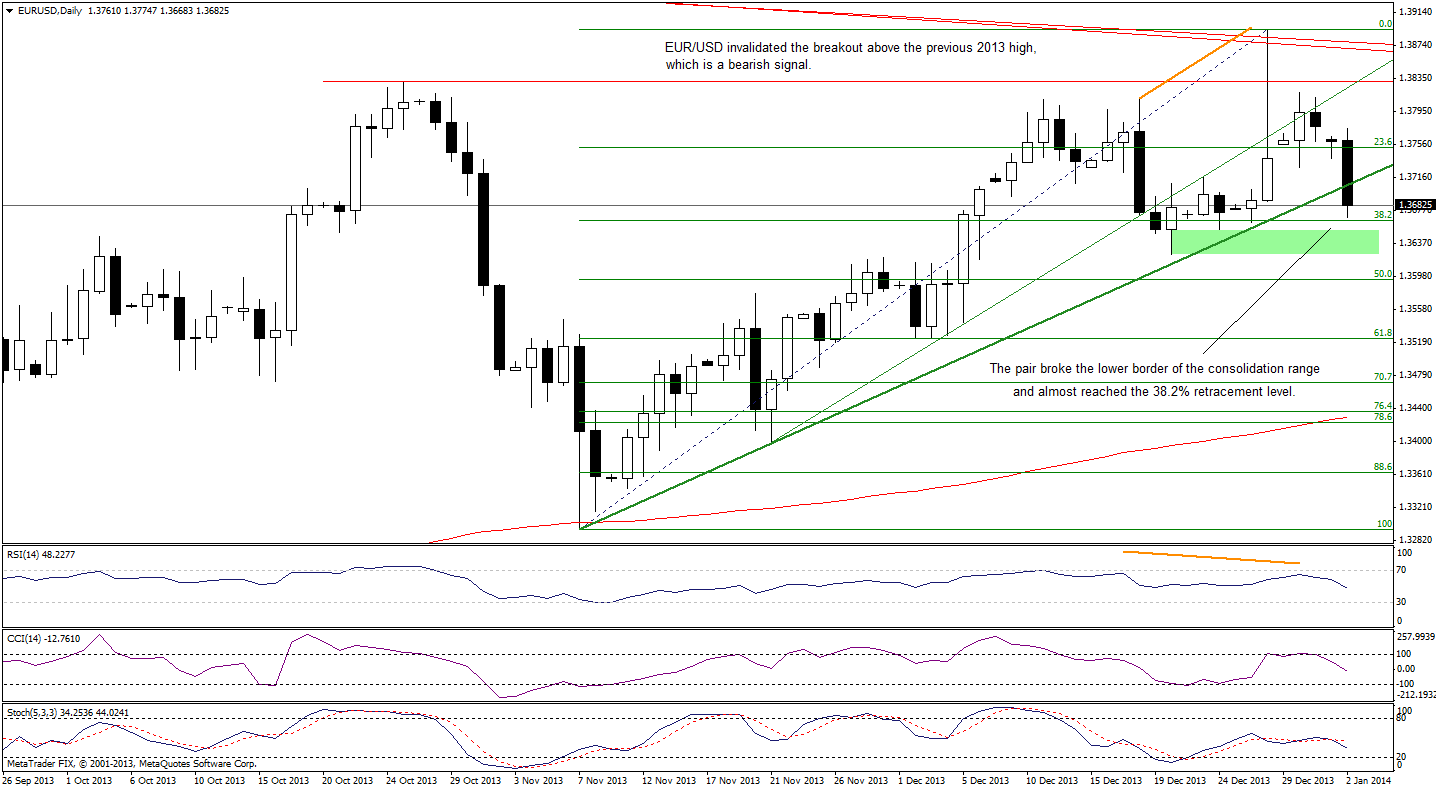
(…) taking into account the length of the upper shadow of Friday’s candlestick, we clearly see the strength of the sellers. Therefore, if they manage to push the price below Friday’s low (which currently intersects with the short-term support line created by the Nov.7 and Nov. 21 lows), we will likely see further deterioration to at least 1.3625 where the Dec. 20 low is.
On the above chart, we see that the situation has deteriorated as the EUR/USD pair broke below the lower border of the consolidation range. With this downward move, the euro also declined below the short-term support line and the 38.2% Fibonacci retracement level based on the entire Nov. - Dec. rally, which is a strong bearish signal. From this perspective, it seems that the downside target (the Dec.20 low) will be reached quite soon. If it encourages the buyers to act, we will likely see an upward correction to at least the short-term support line. However, if it is broken, we will likely see further deterioration and, in this case, the downside target will be around 1.3524 where the 61.8% Fibonacci retracement level intersects with the Dec. 3, 2013 low.
Very short-term outlook: bearish
Short-term outlook: mixed with bearish bias
MT outlook: mixed
LT outlook: bearish
Trading position (short-term): we do not suggest opening any trading positions at the moment. We will keep you informed should anything change, or should we see a confirmation/invalidation of the above.
Once we know the current situation in EUR/USD, let’s move on to GBP/USD.
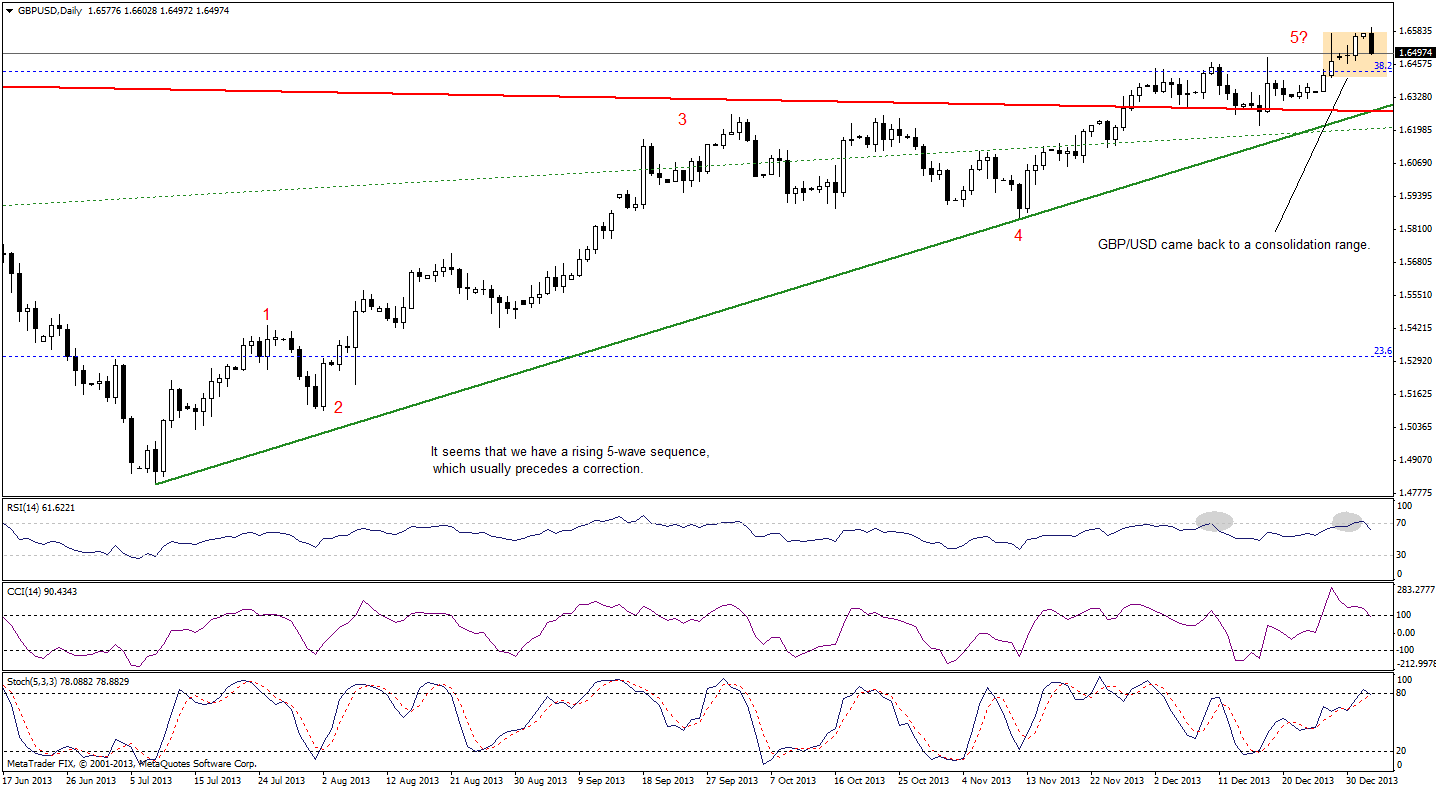
Looking at the above chart we see that GBP/USD broke above the upper line of a consolidation range, but this breakout was almost immediately invalidated, which is a bearish signal. Additionally, if the pound declines below Tuesday’s low, we’ll have an evening star, which is a bearish reversal candlestick pattern.
On top of that, the RSI has declined below the level of 70 and there is a negative divergence between the CCI indicator and the exchange rate, which is not a positive signal. Please note that the CCI and Stochastic Oscillator are close to generating sell signals.
Taking the above into account we should keep in mind what we wrote in our Forex Trading Alert on Monday:
(…) we can notice a rising 5-wave sequence on the above chart (…) according to the Elliott wave theory, this complete sequence usually precedes a correction and if that is the case, the pound will likely drop against the U.S. dollar in the near future. (…) if the pound drops below the red long-term support line (which currently intersects with the green short-term rising support line), it will likely trigger a bigger corrective move.
Very short-term outlook: mixed
Short-term outlook: bullish
MT outlook: bullish
LT outlook: mixed
Trading position (short-term): we do not suggest opening any trading positions at the moment. We will keep you informed should anything change, or should we see a confirmation/invalidation of the above.
Having discussed the current situation in GBP/USD, let’s examine the long-term USD/JPY chart.
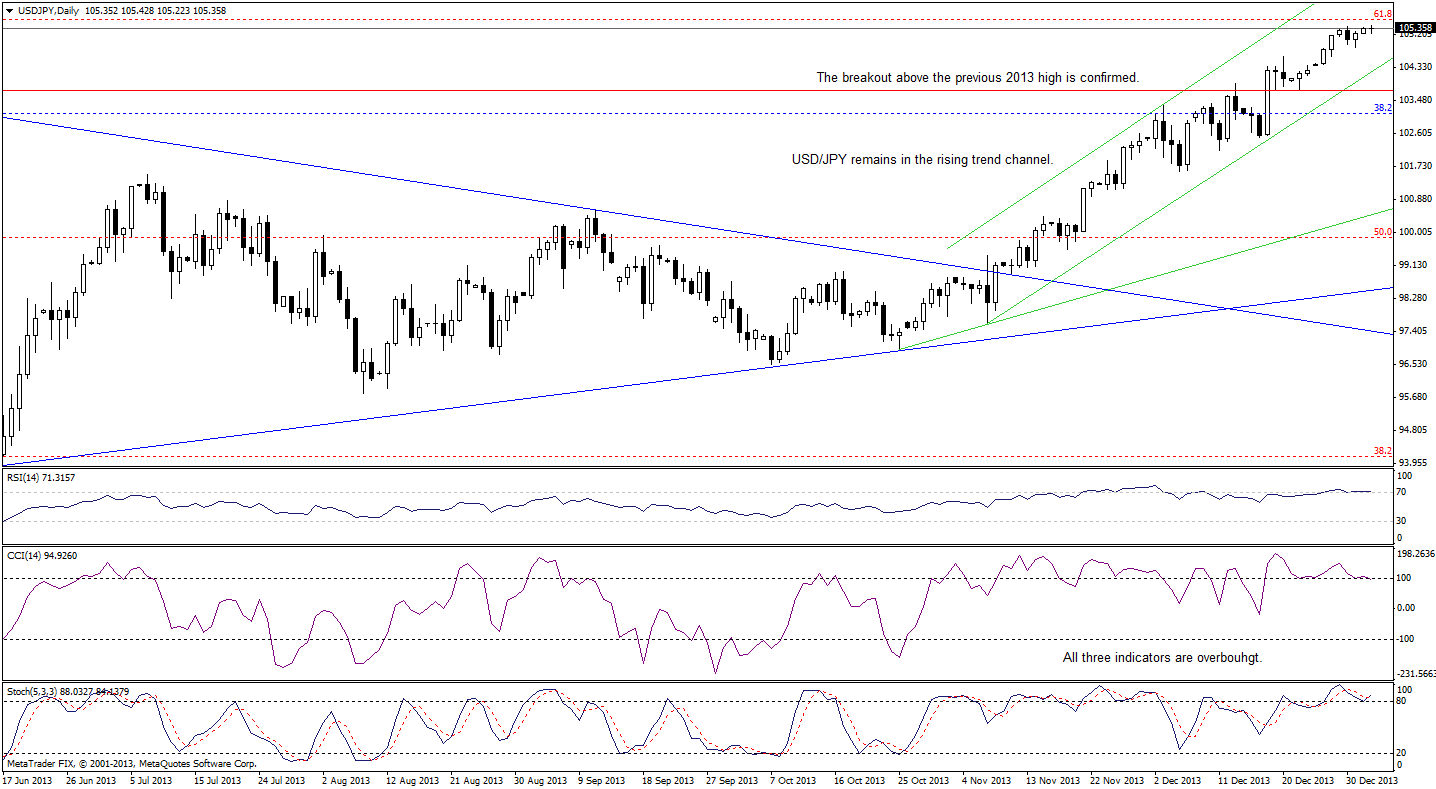
Looking at the above chart, we see that after a very shallow correction, the pair reversed course and hit a fresh five-year high, which is a bullish signal. Despite this positive event, USD/JPY still remains below the strong resistance levels (the 61.8% Fibonacci retracement and the long-term declining resistance line), which may encourage the sellers to act. Additionally, the RSI slipped below the level of 70 and both other indicators are overbought, which suggests that we could see another correction in the coming days.
Please note that the nearest important support is the short-term rising line (which is also the lower border of the rising trend channel) based on the Nov. 7 and Dec. 18 lows. If it is broken, a bigger corrective move is likely to be seen.
Very short-term outlook: bullish
Short-term outlook: bullish
MT outlook: bullish
LT outlook: bearish
Trading position (short-term): we do not suggest opening any trading positions at the moment. However, if the pair drops below the short-term rising support line (and confirms the breakdown) we will consider opening speculative short positions.
Once we know the above, let’s focus on the long-term USD/CAD chart.
In our previous Forex Trading Alert, we wrote the following:
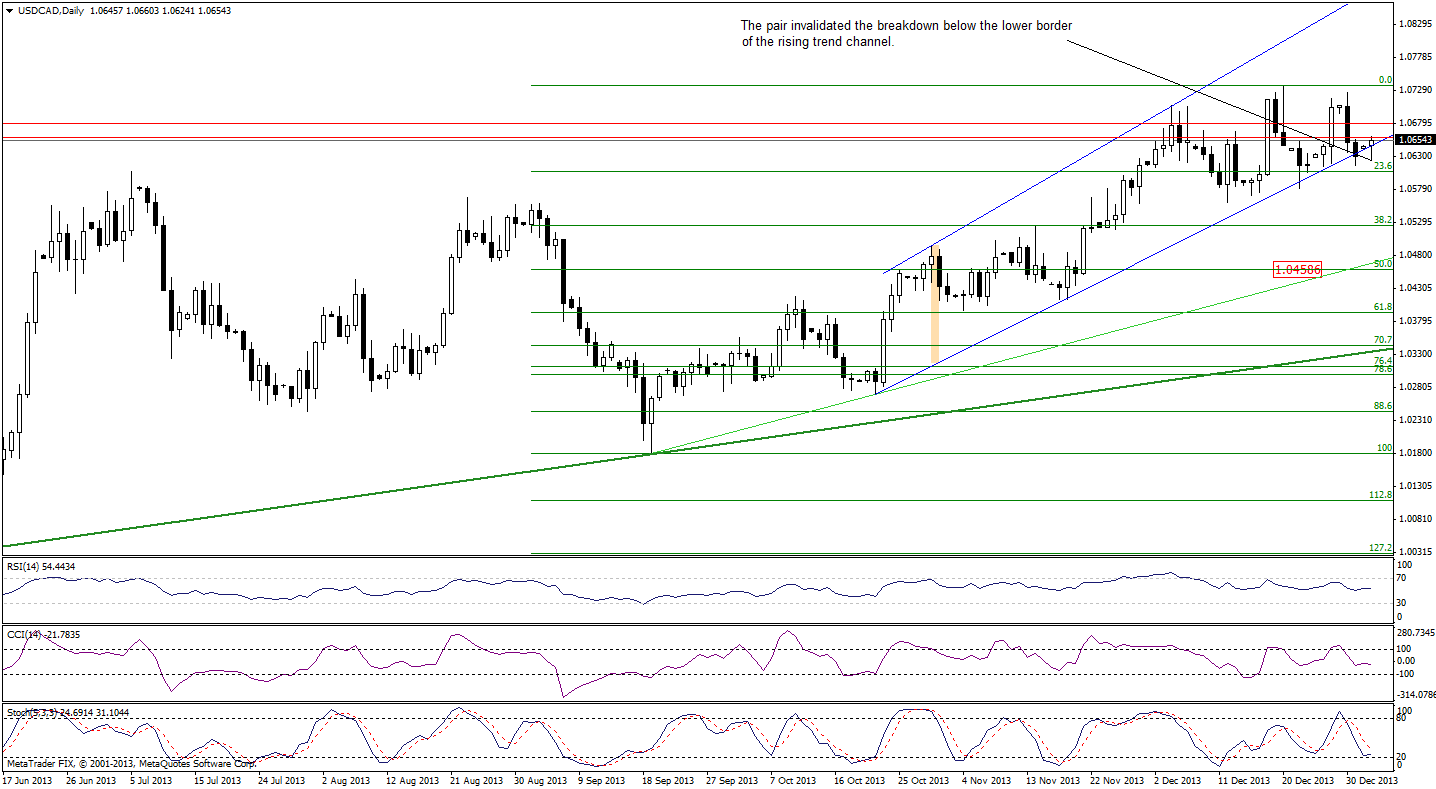
(…) the pair has declined and reached the lower border of the rising trend channel. If USD/CAD breaks below this line, we will likely see further deterioration. However, as long as the pair remains above the Dec. 23 low, a bigger decline is not a sure bet because we already saw a small decline below the lower border of the rising trend channel, which was almost immediately invalidated.
On the above chart, we see similar price action as USD/CAD slipped below the lower border of the rising trend channel and almost immediately invalidated the breakdown. Although this is a positive signal, the current upswing is small and another attempt to move below the lower border of the rising trend channel should not surprise us.
Please note that if the pair confirms the breakdown below the lower border of the rising trend channel, the downside target for the sellers will be around 1.0459 where the 50% Fibonacci retracement level (based on the entire Sept. - Dec. rally) is.
When we take a closer look at the position of the indicators, we clearly see that they have declined once again and sell signals generated by the CCI and Stochastic Oscillator remain in place, which is a bearish signal.
Very short-term outlook: mixed with bearish bias
Short-term outlook: mixed
MT outlook: bullish
LT outlook: bearish
Trading position (short-term): we do not suggest opening any trading positions at the moment. However, if the pair confirms the breakdown below the lower border of the rising trend channel, we will consider opening speculative short positions.
Let’s move on to the USD/CHF long-term chart.
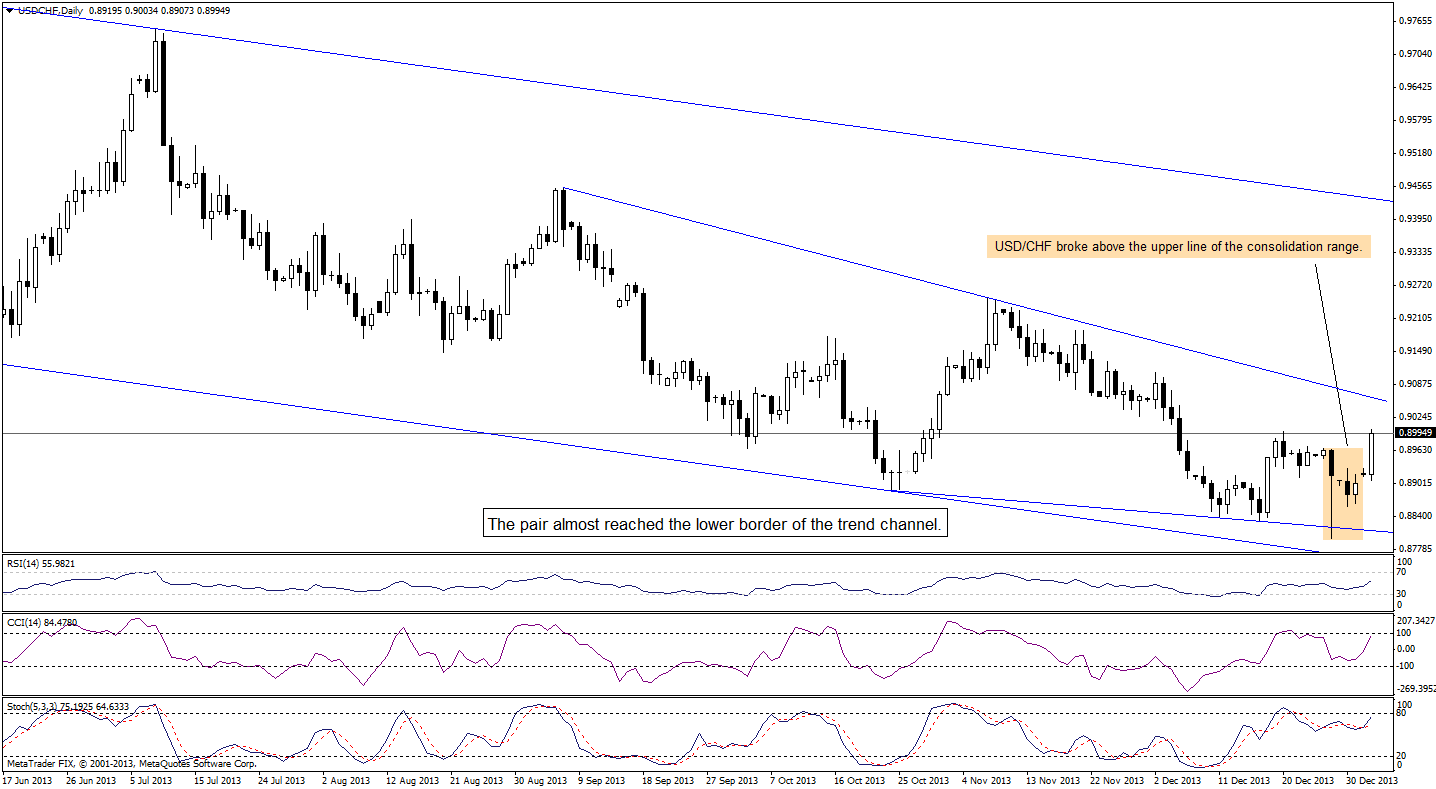
Looking at the above chart, we see that the situation has improved on a very short-term basis as USD/CHF broke above the upper line of the consolidation range. Despite this sharp upward move that we saw earlier today, the pair still remains below the short-term declining resistance line based on the September and November highs. Therefore, according to what we wrote in our last Forex Trading Alert, the short-term trend remains down at least as long as the pair is trading below this resistance line.
Very short-term outlook: mixed with bullish bias
Short-term outlook: bearish
MT outlook: bearish
LT outlook: bearish
Trading position (short-term): we do not suggest opening any trading positions at the moment. We will keep you informed should anything change, or should we see a confirmation/invalidation of the above.
Thank you.
Nadia Simmons
Forex & Oil Trading Strategist
Oil Investment Updates
Oil Trading Alerts
