
Forex Trading Positions - Summary:
- EUR/USD: none
- GBP/USD: none
- USD/JPY: none
- USD/CAD: none
- USD/CHF: none
Details:
Today, we’ll start with the daily chart of the EUR/USD pair.
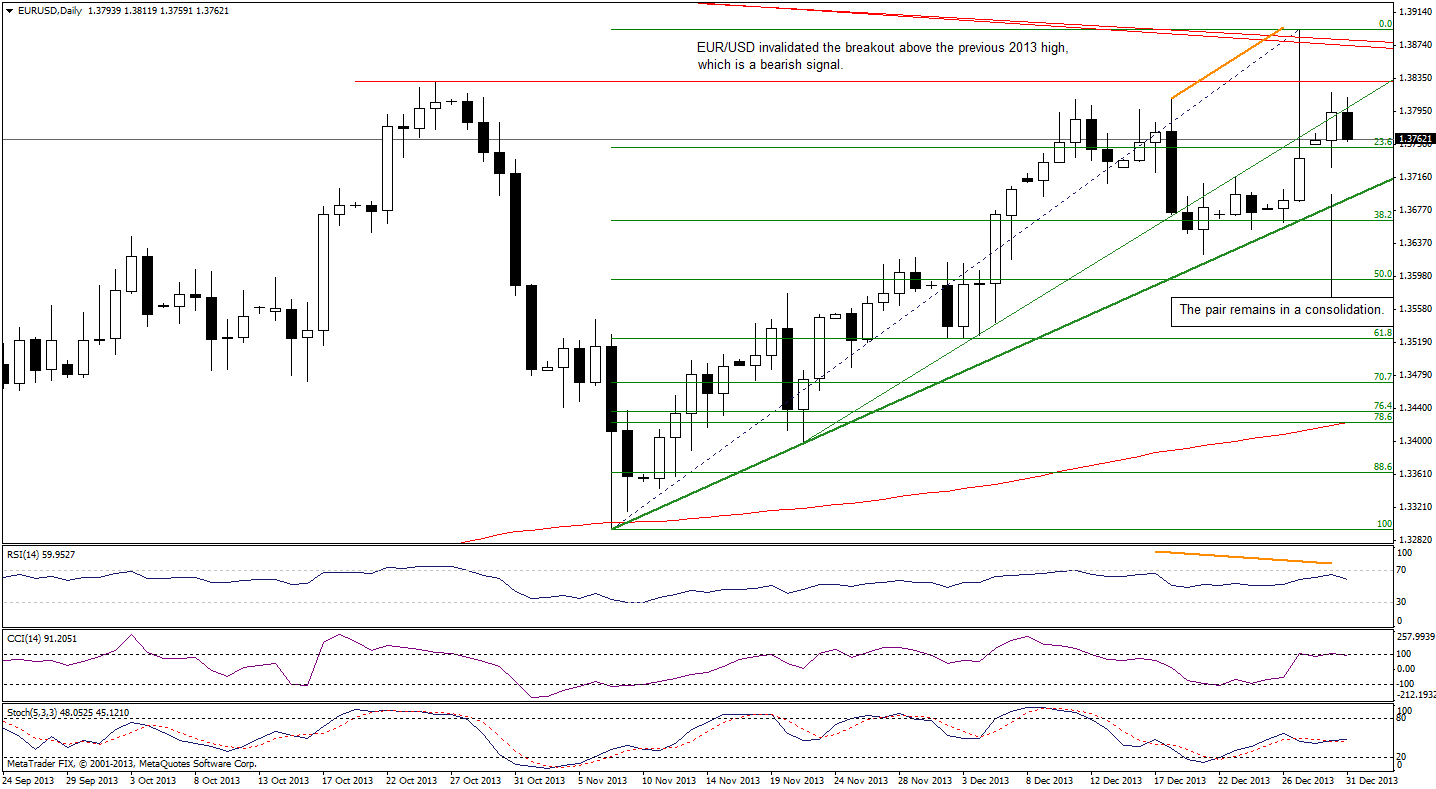
On the above chart, we see that the situation hasn’t changed much since yesterday. The EUR/USD pair remains in a consolidation range and what we wrote in our previous Forex Trading Alert remains up-to date.
(…) taking into account the length of the upper shadow of Friday’s candlestick, we clearly see the strength of the sellers. Therefore, if they manage to push the price below Friday’s low (which currently intersects with the short-term support line created by the Nov.7 and Nov. 21 lows), we will likely see further deterioration to at least 1.3625 where the Dec. 20 low is.
Very short-term outlook: mixed
Short-term outlook: bullish with bearish bias
MT outlook: mixed
LT outlook: bearish
Trading position (short-term): we do not suggest opening any trading positions at the moment.
Once we know the current situation in EUR/USD, let’s move on to GBP/USD.
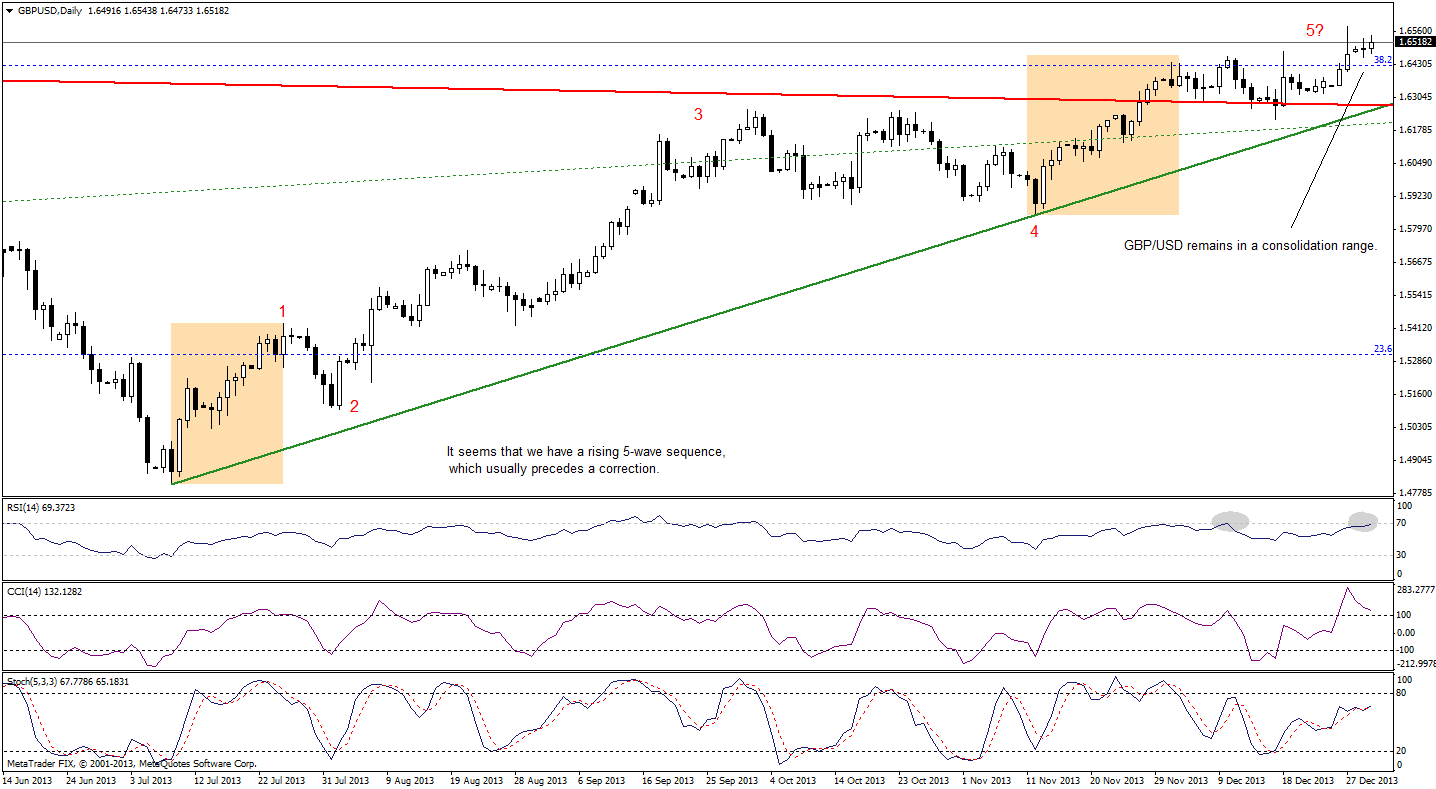
Looking at the above chart we see that GBP/USD remains in a consolidation range, slightly above the previous 2013 high. From this perspective, it seems that the breakout/breakdown above/below the upper/lower line of the consolidation range will likely show the direction of the future move.
However, we should keep in mind that the RSI has almost reached the level of 70 and there is a negative divergence between the CCI indicator and the course, which is not a positive signal.
Quoting our previous Forex Trading Alert:
(…) if the pound drops below the red long-term support line (which currently intersects with the green short-term rising support line), it will likely trigger a bigger corrective move. Please note that we can notice a rising 5-wave sequence on the above chart, which is in tune with the above assumption. According to the Elliott wave theory, this complete sequence usually precedes a correction and if that is the case, the pound will likely drop against the U.S. dollar in the near future. Additionally, when we take a closer look, we see that wave 1 is similar to wave 5, which reinforces the above. Therefore, we should keep an eye on this pair because it seems that a bigger move is just around the corner.
Very short-term outlook: mixed
Short-term outlook: bullish
MT outlook: bullish
LT outlook: mixed
Trading position (short-term): we do not suggest opening any trading positions at the moment.
Having discussed the current situation in GBP/USD, let’s examine the long-term USD/JPY chart.
Quoting our previous Forex Trading Alert:
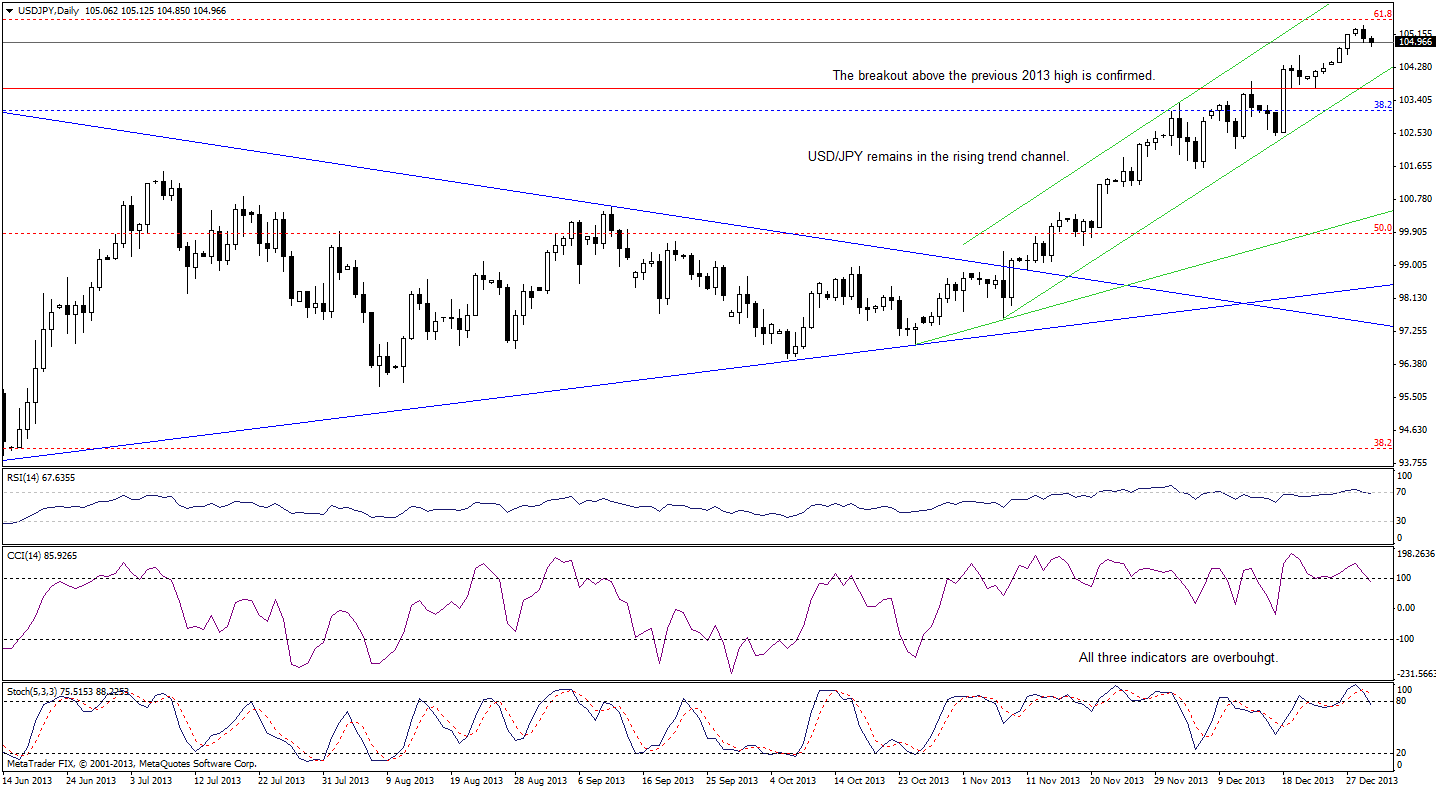
(…) the USD/JPY pair remains in the short-term uptrend, which is not threatened at the moment from technical point of view. However, when we take a look at the indicators, we clearly see that the RSI is overbought (above the level of 70), which suggests that we could see a pause or correction. Additionally, we can notice a negative divergence between the CCI and the course, which is a bearish signal. On top of that, both other indicators are overbought and very close to generating sell signals. Taking these circumstances into account, and combining them with the proximity to the strong resistance levels (the 61.8% Fibonacci retracement and the long-term declining resistance line), the pair could reverse course in the near future.
Looking at the above chart, we see that the pair actually reversed course, however, the current correction is very shallow and doesn’t change the very short-term and short-term outlook. Nevertheless, the RSI slipped below the level of 70 and the CCI generated a sell signal, which suggests that we could see further deterioration in the coming days.
Please note that the nearest important support is the short-term rising line (which is also the lower border of the rising trend channel) based on the Nov. 7 and Dec. 18 lows. If it is broken, a bigger corrective move is likely to be seen.
Very short-term outlook: bullish
Short-term outlook: bullish
MT outlook: bullish
LT outlook: bearish
Trading position (short-term): we do not suggest opening any trading positions at the moment. However, if the pair drops below the short-term rising support line (and confirms the breakdown) we will consider opening speculative short positions.
Once we know the above, let’s focus on the long-term USD/CAD chart.
In our previous Forex Trading Alert, we wrote the following:
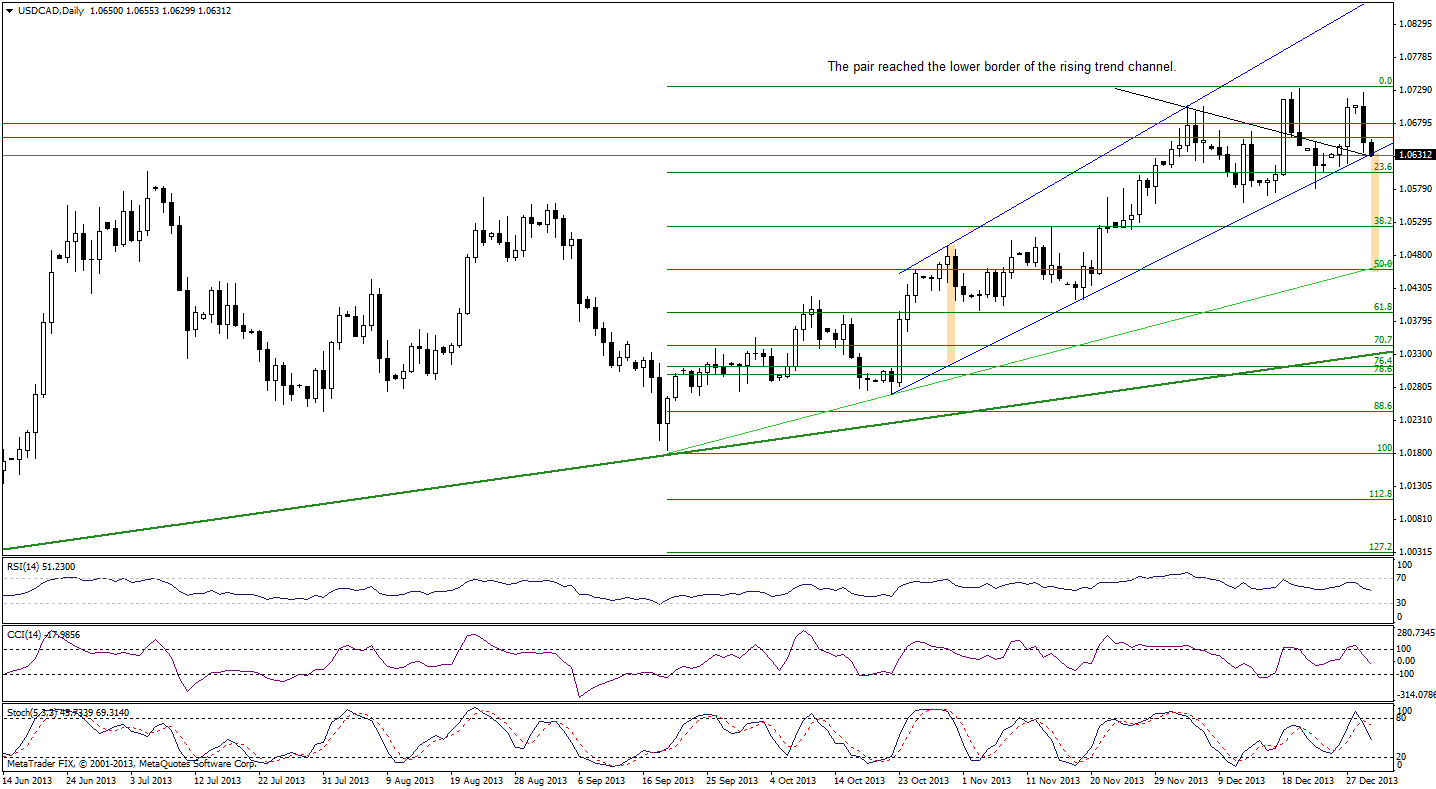
(…) the pair has been trading in the narrow range since the U.S. dollar hit an annual high against the Canadian dollar. From this perspective, it seems that the breakout above the 2013 high will trigger an upswing to the 38.2% Fibonacci retracement. On the other hand, the breakdown below the Dec. 23 low will likely push the pair lower – to at least 1.0524 where the Nov. 14 high is (…) we should keep in mind that both other indicators are overbought and may generate sell signals in the coming days, which will likely encourage sellers to act.
On the above chart, we see that the pair has declined and reached the lower border of the rising trend channel. If USD/CAD breaks below this line, we will likely see further deterioration. However, as long as the pair remains above the Dec. 23 low, a bigger decline is not a sure bet because we already saw a small decline below the lower border of the rising trend channel, which was almost immediately invalidated.
Please note that if the pair confirms the breakdown below the lower border of the rising trend channel, the downside target for the sellers will be around 1.0459 where the 50% Fibonacci retracement level (based on the entire Sept.-Dec. rally) is.
When we take a closer look at the position of the indicators, we clearly see that they have declined and the CCI and Stochastic Oscillator generated sell signals, which is a bearish signal.
Very short-term outlook: mixed with bearish bias
Short-term outlook: bullish with bearish bias
MT outlook: bullish with bearish bias
LT outlook: bearish
Trading position (short-term): we do not suggest opening any trading positions at the moment. However, if the pair confirms the breakdown below the lower border of the rising trend channel, we will consider opening speculative short positions.
Let’s move on to the USD/CHF long-term chart.
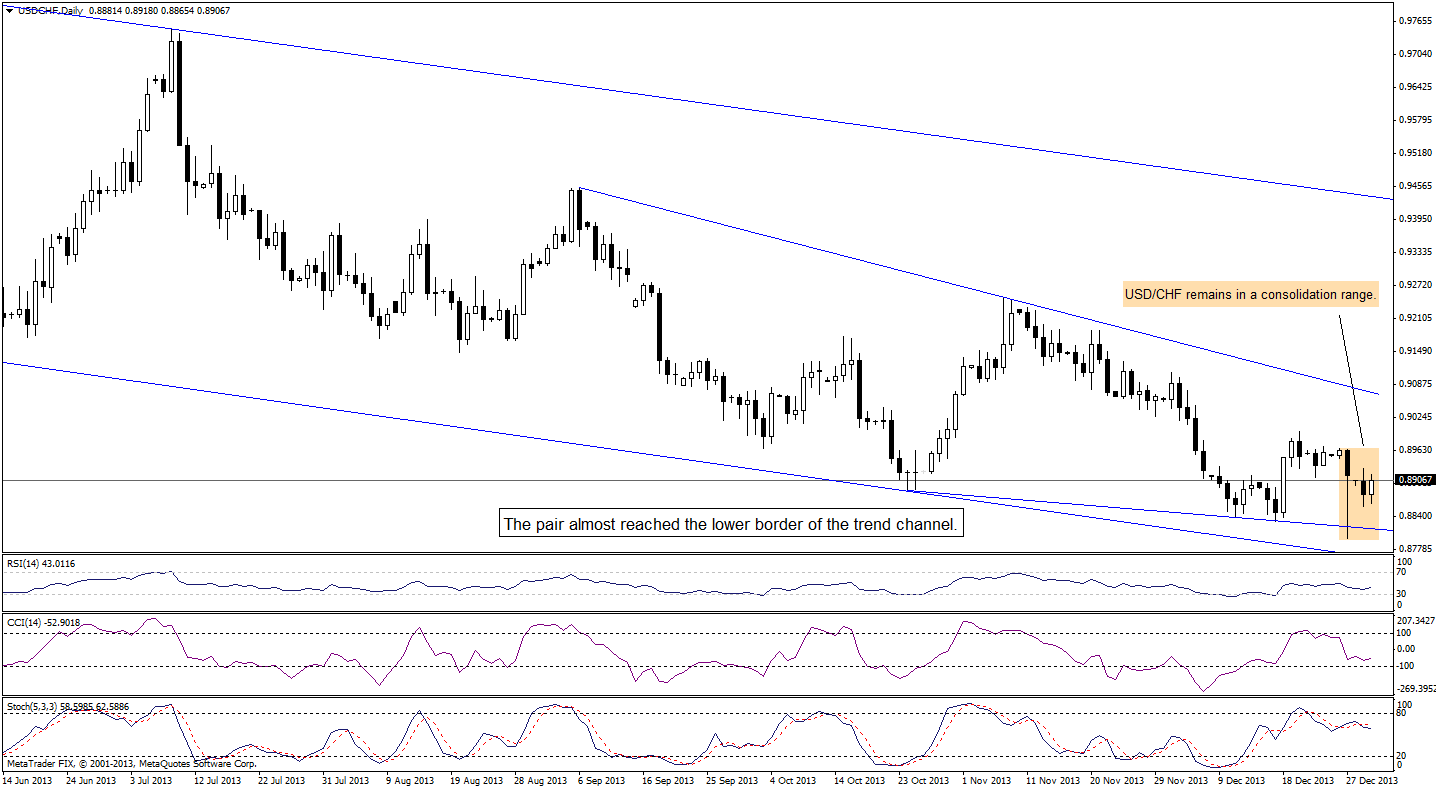
Looking at the above chart, we see that the situation hasn’t changed much since our last Forex Trading Alert was posted, therefore, what we wrote back then remains up to date.
(…) after a drop to a fresh annual low USD/CHF rebounded sharply, however, it still remains below the previous week’s high. From this perspective, the short-term trend remains down at least as long as the pair is trading below the short-term declining resistance line based on the September and November highs.
Although the pair bounced off the strong support zone created by the 38.2% Fibonacci retracement level and the lower border of the short-term declining trend channel, it is too early to conclude that the bigger upward correction move is just around the corner.
Very short-term outlook: mixed
Short-term outlook: bearish
MT outlook: bearish
LT outlook: bearish
Trading position (short-term): we do not suggest opening any trading positions at the moment.
Finishing today’s Forex Trading Alert, I would like to wish you a Happy and Profitable New Year.
Thank you.
Nadia Simmons
Forex & Oil Trading Strategist
Oil Investment Updates
Oil Trading Alerts
