

Forex Trading Alert originally sent to subscribers on January 5, 2016, 7:47 AM.
Earlier today, official data showed that the annual rate of inflation in the euro zone increased by 0.2% in Dec, missing forecasts for an increase of 0.3%. Additionally, core inflation (without food and energy costs) rose 0.9% in the previous month, also below forecasts for 1.0%. Thanks to these disappointing numbers, EUR/USD extended losses and broke below important support zone. How low could the exchange rate go in the coming days?
In our opinion the following forex trading positions are justified - summary:
- EUR/USD: short (stop-loss order at 1.1363; initial downside target at 1.0462)
- GBP/USD: none
- USD/JPY: none
- USD/CAD: none
- USD/CHF: none
- AUD/USD: none
EUR/USD
Quoting our yesterday’s alert:
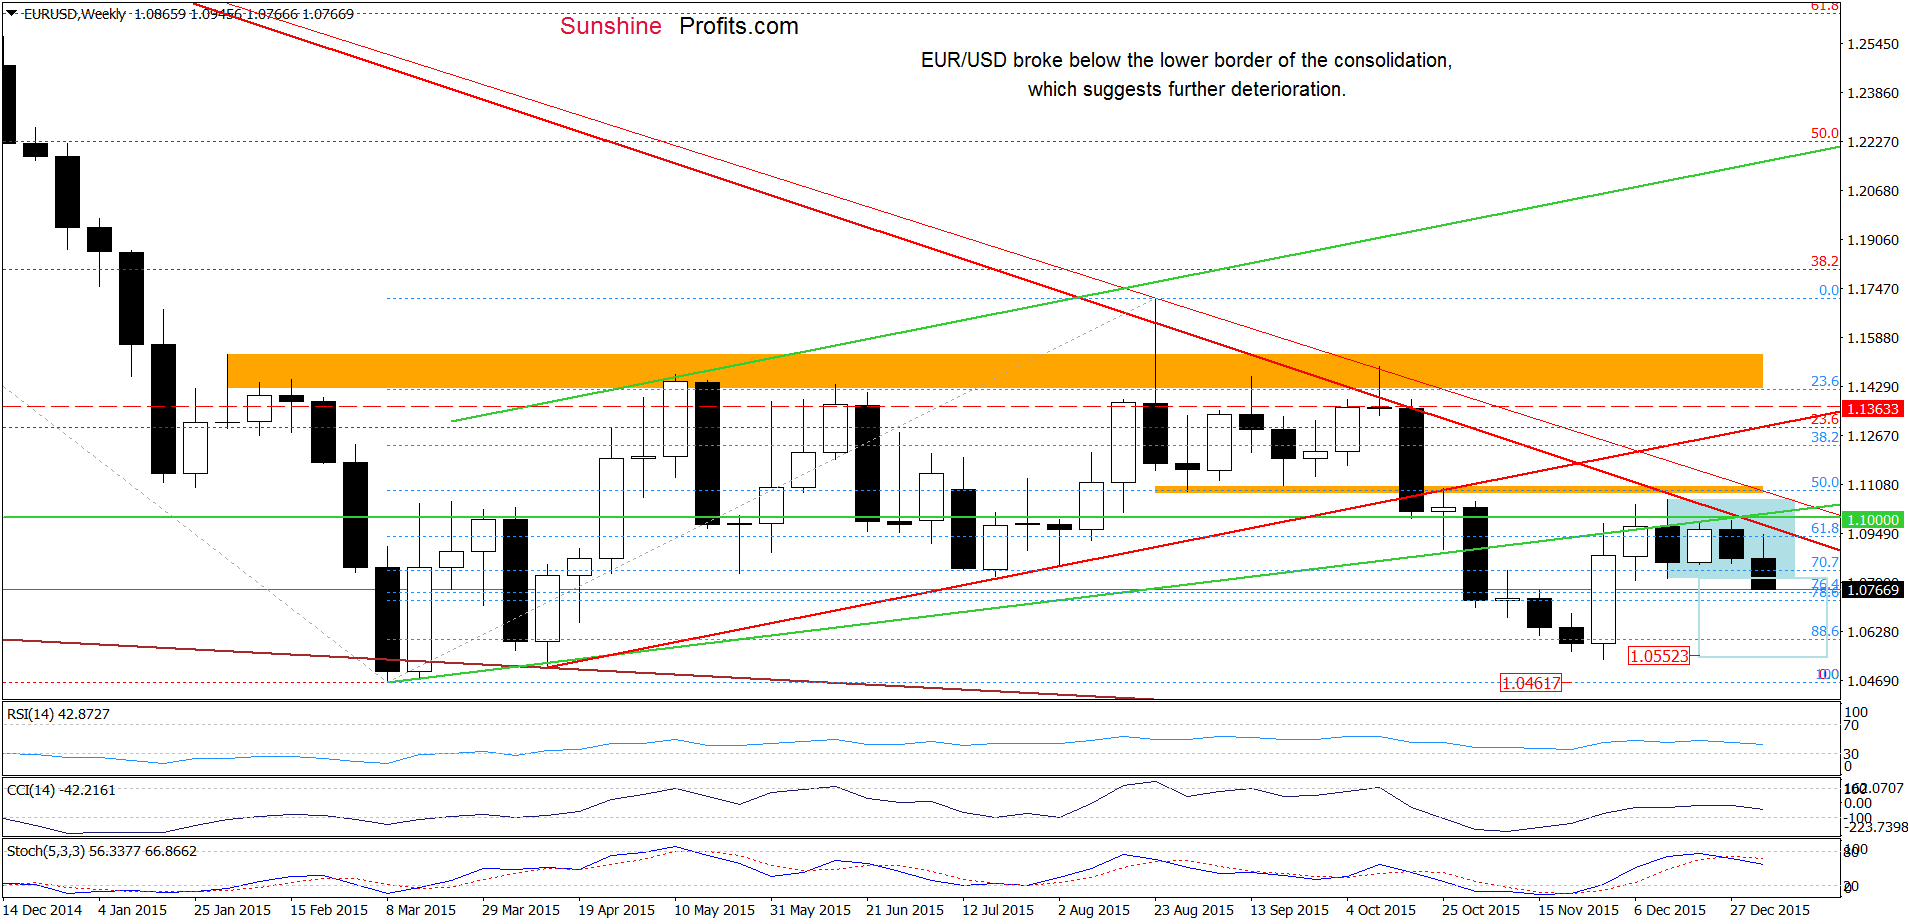
(…) the exchange rate is consolidating under the solid resistance zone (created by the previously-broken green resistance line, the barrier of 1.1000, the orange resistance zone and the long-term red declining resistance line). In previous weeks, this area was strong enough to stop currency bulls and trigger pullbacks, which suggests that we’ll likely see similar price action in near future. If this is the case, and the pair breaks under the lower line of the formation, the initial downside target would be around 1.0552, where the size of the downward move will correspond to the height of the consolidation (please note that slightly below this price target is the Nov low, which serves as the nearest medium-term support).
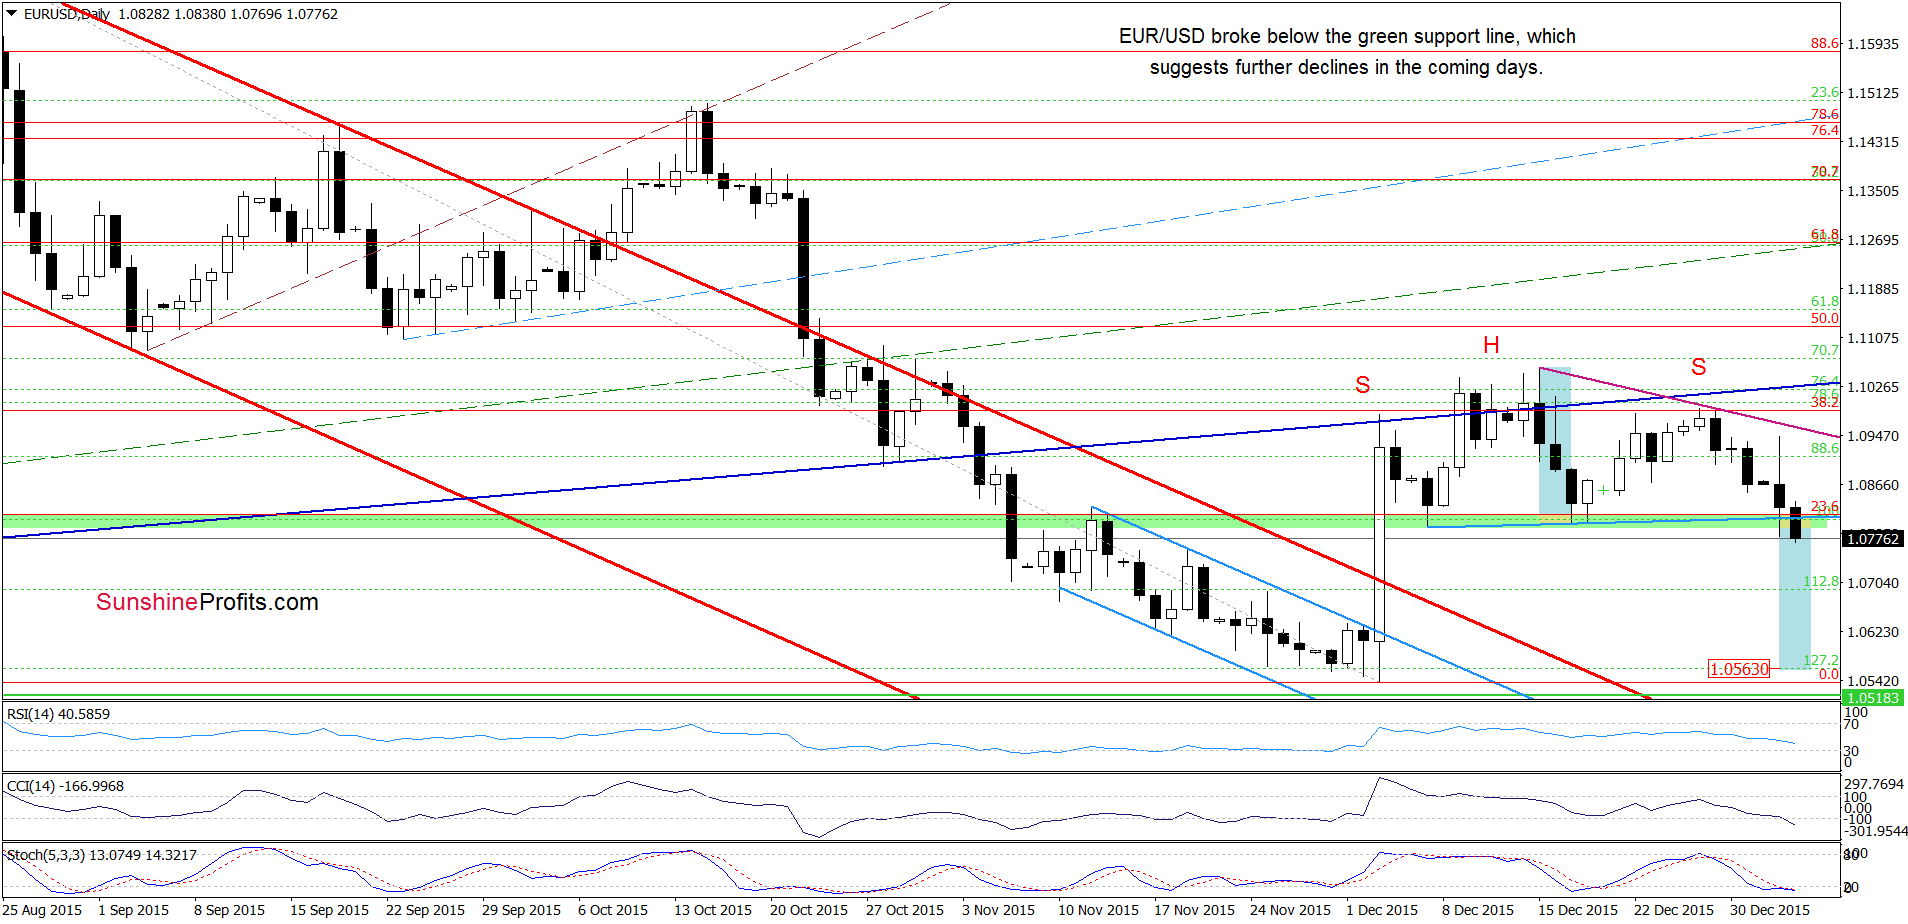
Looking at the weekly chart, we see that the situation developed in tune with the above scenario and EUR/USD broke below the lower border of the consolidation. With this move, the pair also declined under the green support zone (marked on the daily char), which means that the head and shoulders pattern is underway and a drop to around 1.0563 is more likely than not (in this area the size of the move will correspond to the height of the bearish pattern).
Very short-term outlook: bearish
Short-term outlook: bearish
MT outlook: bearish
LT outlook: mixed
Trading position (short-term; our opinion): Short positions (with a stop-loss order at 1.1363 and the initial downside target at 1.0462) are justified from the risk/reward perspective. We will keep you informed should anything change, or should we see a confirmation/invalidation of the above.
USD/CHF
In our previous commentary on this currency pair, we wrote:
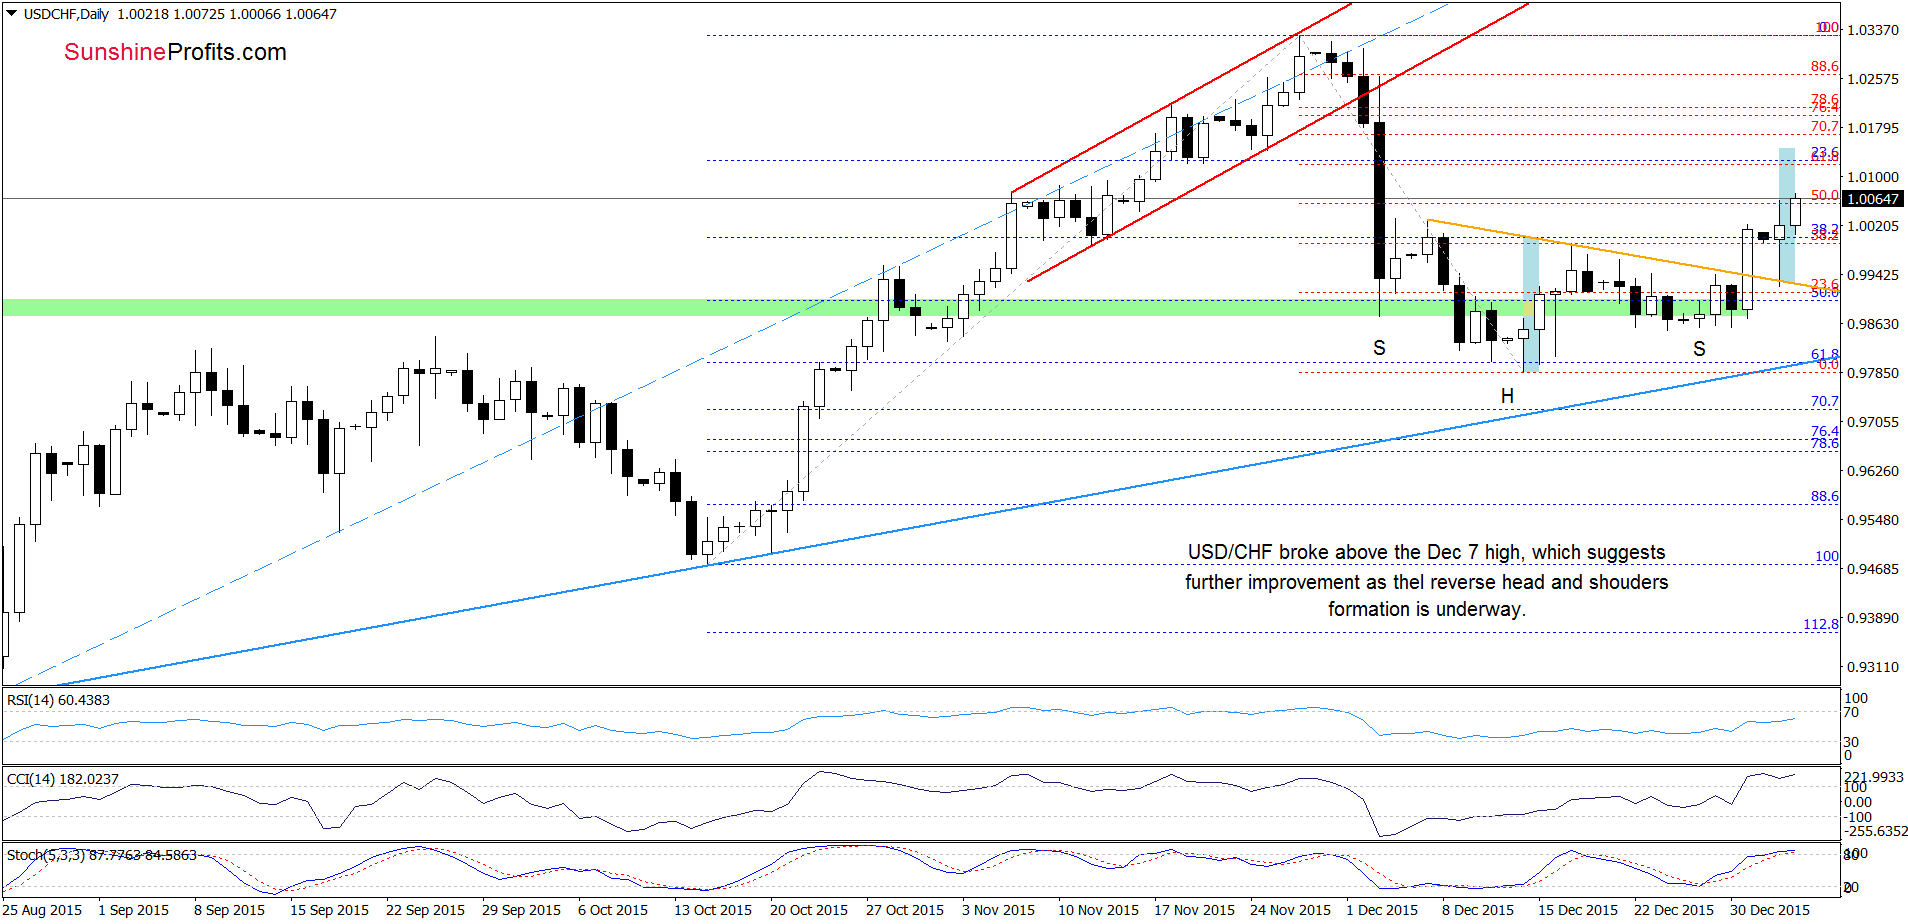
(…) a potential reverse head and shoulders formation is underway (…) the formation will be more reliable if USD/CHF breaks above the orange resistance line (the neck line of the formation) based on the previous highs. (…) the Stochastic Oscillator generated a buy signal, which increases the probability that currency bulls will start to act in the coming days.
From today’s point of view, we see that USD/CHF broke not only above the orange resistance line, but also the Dec 7 high, which suggests further improvement. How high could the pair go? In our opinion, the initial upside target will be around 1.0144, where the size of the move will correspond to the height of the reverse head and shoulders formation.
But will USD/CHF climb higher in the coming weeks? Let’s examine the weekly char and find out what can we infer from it.
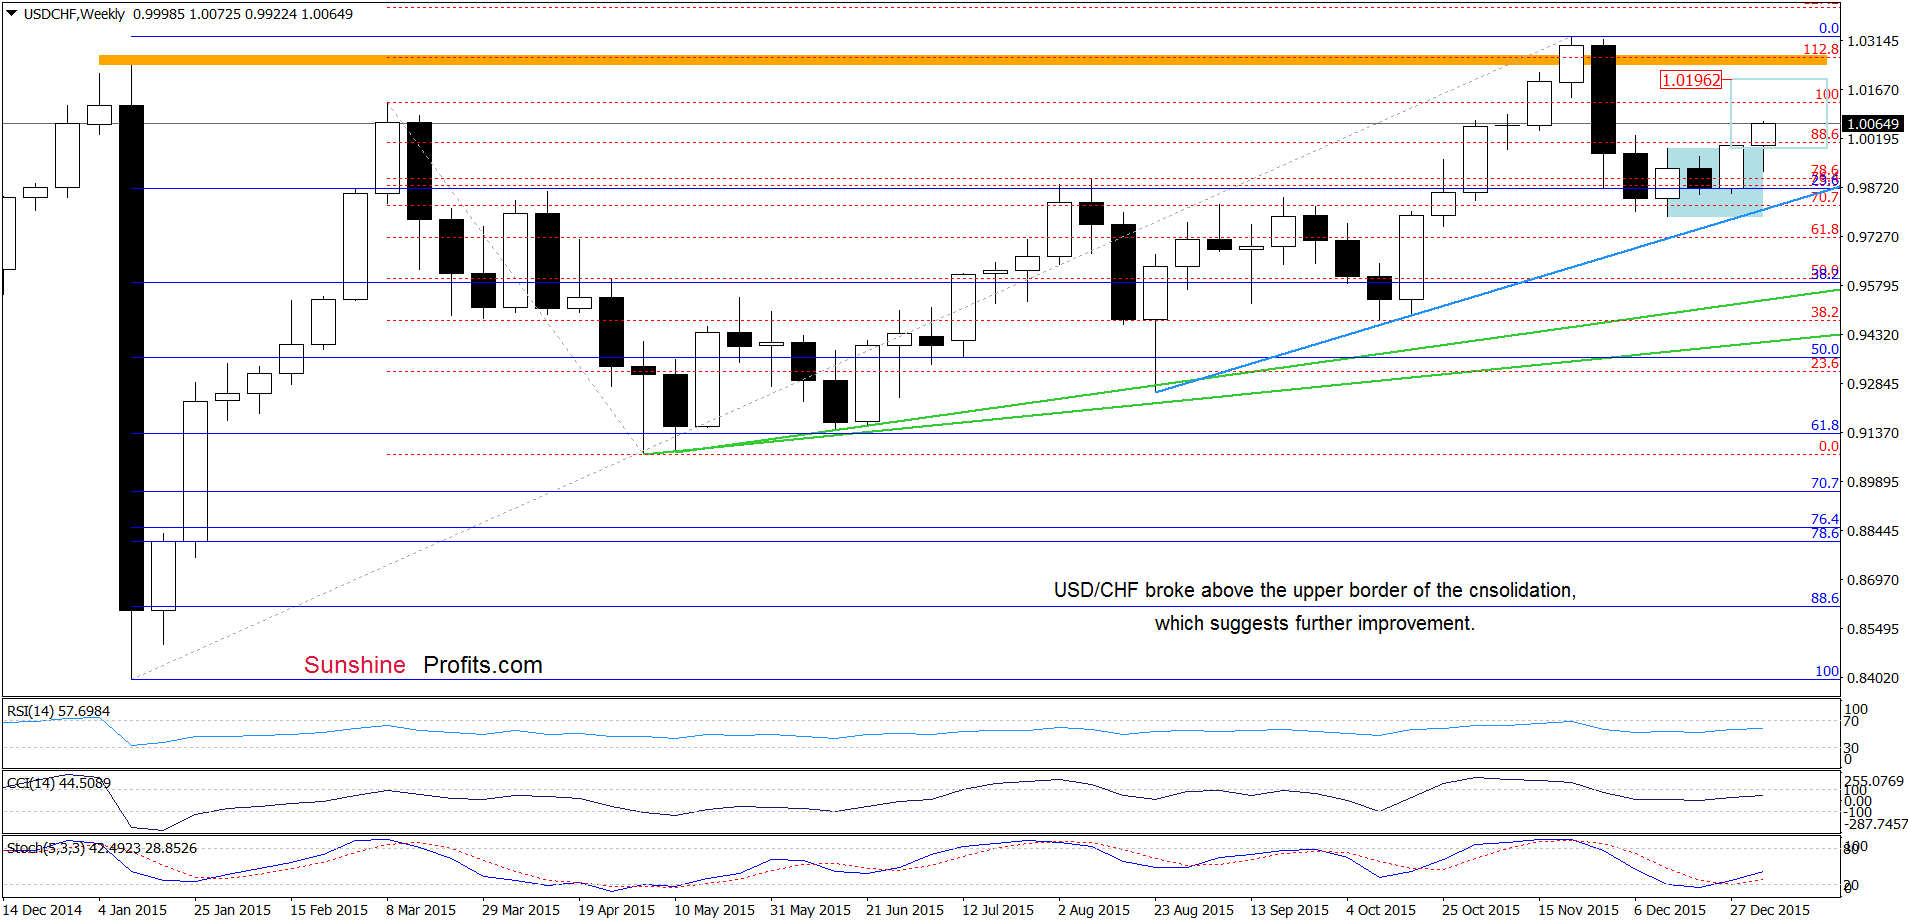
From this perspective, we see that USD/CHF broke above the upper border of the consolidation, which suggests an increase to around 1.0196.
Very short-term outlook: bullish
Short-term outlook: mixed with bullish bias
MT outlook: mixed
LT outlook: mixed
Trading position (short-term; our opinion): No positions are justified from the risk/reward perspective. We will keep you informed should anything change, or should we see a confirmation/invalidation of the above.
AUD/USD
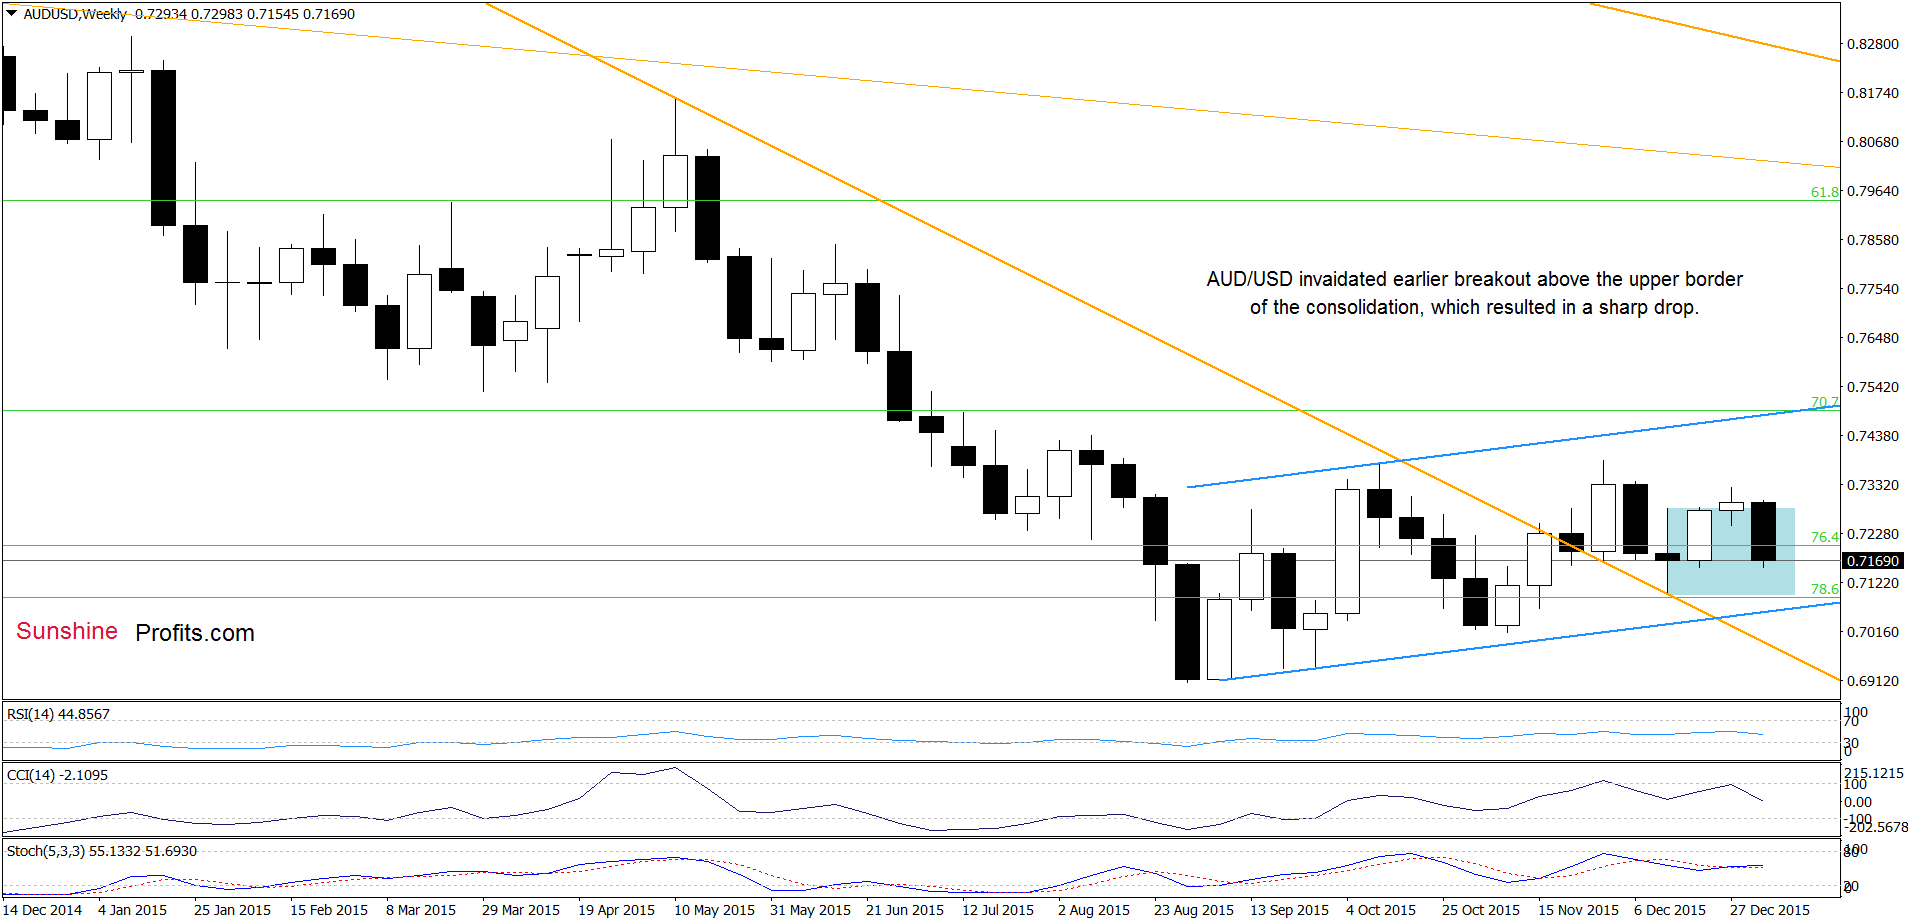
The first thing that catches the eye on the weekly chart is an invalidation of the breakout above the upper border of the consolidation. This bearish signal encouraged currency bears to act and pushed the exchange rate sharply lower.
What impact did this move have on the very short-term picture? Let’s check.
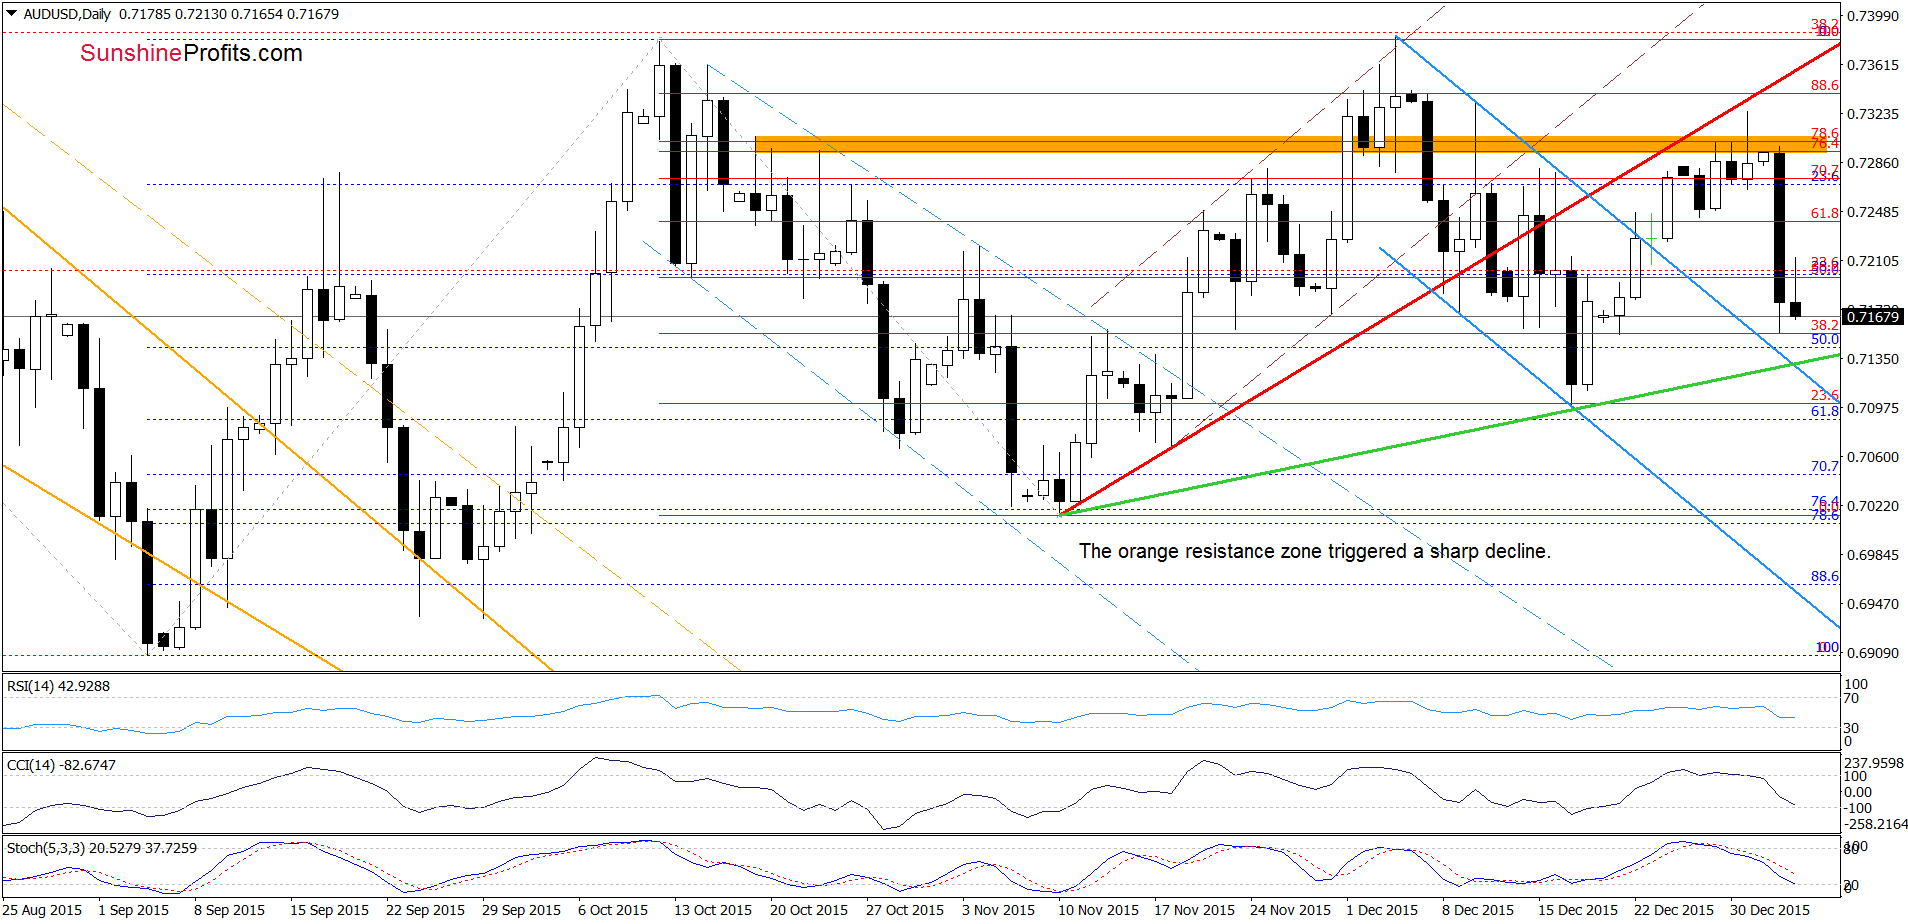
Quoting our Forex Trading Alert posted on Dec 30:
(…) the pair reached the orange resistance zone (created by the 76.4% and 78.6% Fibonacci retracements). As you see on the daily chart, the proximity to this resistance area was enough to encourage currency bears to act in the previous week and also in mid-Dec. Taking this fact into account, and combining it with the current position of the indictors (they are very close to generating sell signals), we think that further deterioration is just around the corner.
Looking at the daily chart, we see that currency bears showed their claws and pushed the pair sharply lower yesterday. Taking this fact into account, we believe that our downside target from the above-mentioned alert would be in play in the coming day(s):
If (…) AUD/USD declines from here, we’ll see a test of the previously-broken upper line of the blue declining trend channel in the coming days.
Very short-term outlook: bearish
Short-term outlook: mixed with bearish bias
MT outlook: mixed
LT outlook: mixed
Trading position (short-term; our opinion): No positions are justified from the risk/reward perspective. We will keep you informed should anything change, or should we see a confirmation/invalidation of the above.
Thank you.
Nadia Simmons
Forex & Oil Trading Strategist
Przemyslaw Radomski, CFA
Founder, Editor-in-chief
Gold & Silver Trading Alerts
Forex Trading Alerts
Oil Investment Updates
Oil Trading Alerts
