

Forex Trading Alert originally sent to subscribers on October 15, 2015, 6:04 AM.
Although the Australian Bureau of Statistics showed that the number of employed people declined by 5,100 in the previous month (missing expectations for an increase of 5,000), Australia's unemployment rate remained unchanged at 6.2% in Sept. Thanks to these numbers, AUD/USD extended yesterday’s gains, erasing most of the Tuesday decline. Will we see a fresh Oct high in the coming days?
In our opinion the following forex trading positions are justified - summary:
- EUR/USD: short (a stop-loss order at 1.1887; the downside target around 1.0938)
- GBP/USD: none
- USD/JPY: none
- USD/CAD: none
- USD/CHF: none
- AUD/USD: none
EUR/USD
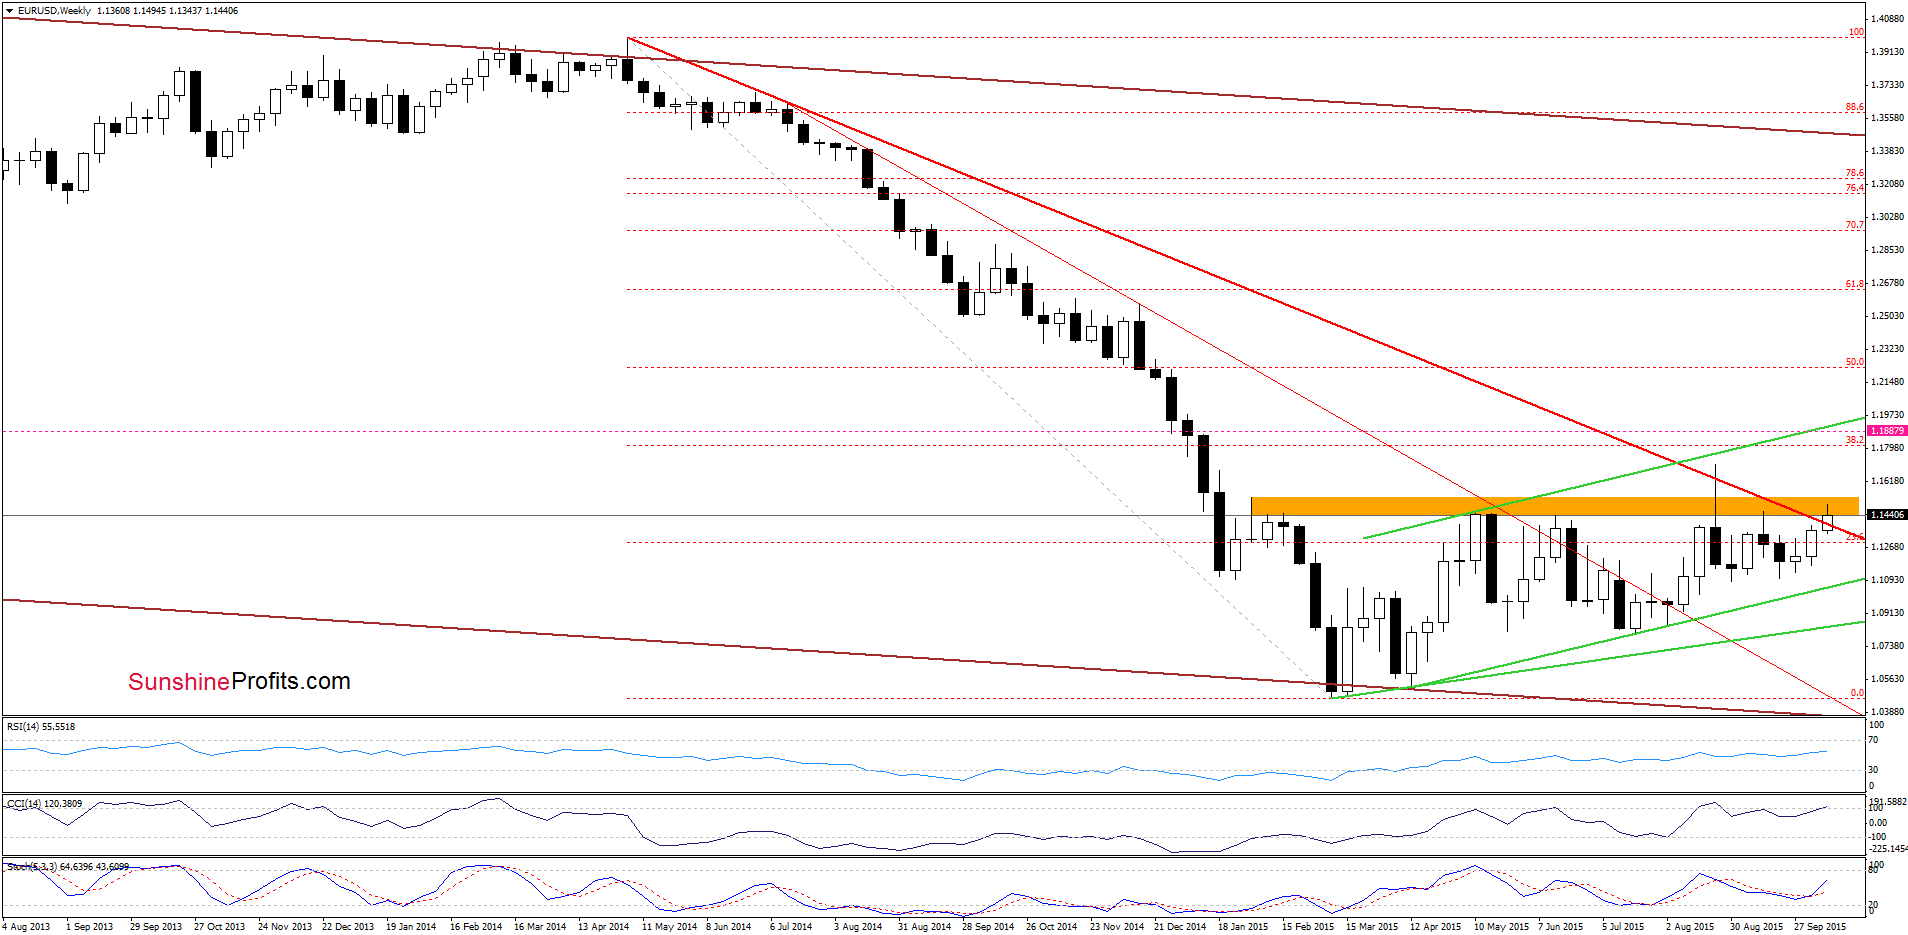
From this perspective, we see that EUR/USD extended gains and broke above the long-term red declining resistance line. Although this is a positive signal, which suggests further improvement, we should keep in mind that the exchange rate still remains under the orange resistance zone (reinforced by the bearish evening pattern). In previous weeks this area was strong enough to stop currency bulls and trigger a pullback, which suggests that the space for further rally may be limited.
Having said that, let’s find out what impact did this increase have on the very short-term picture.
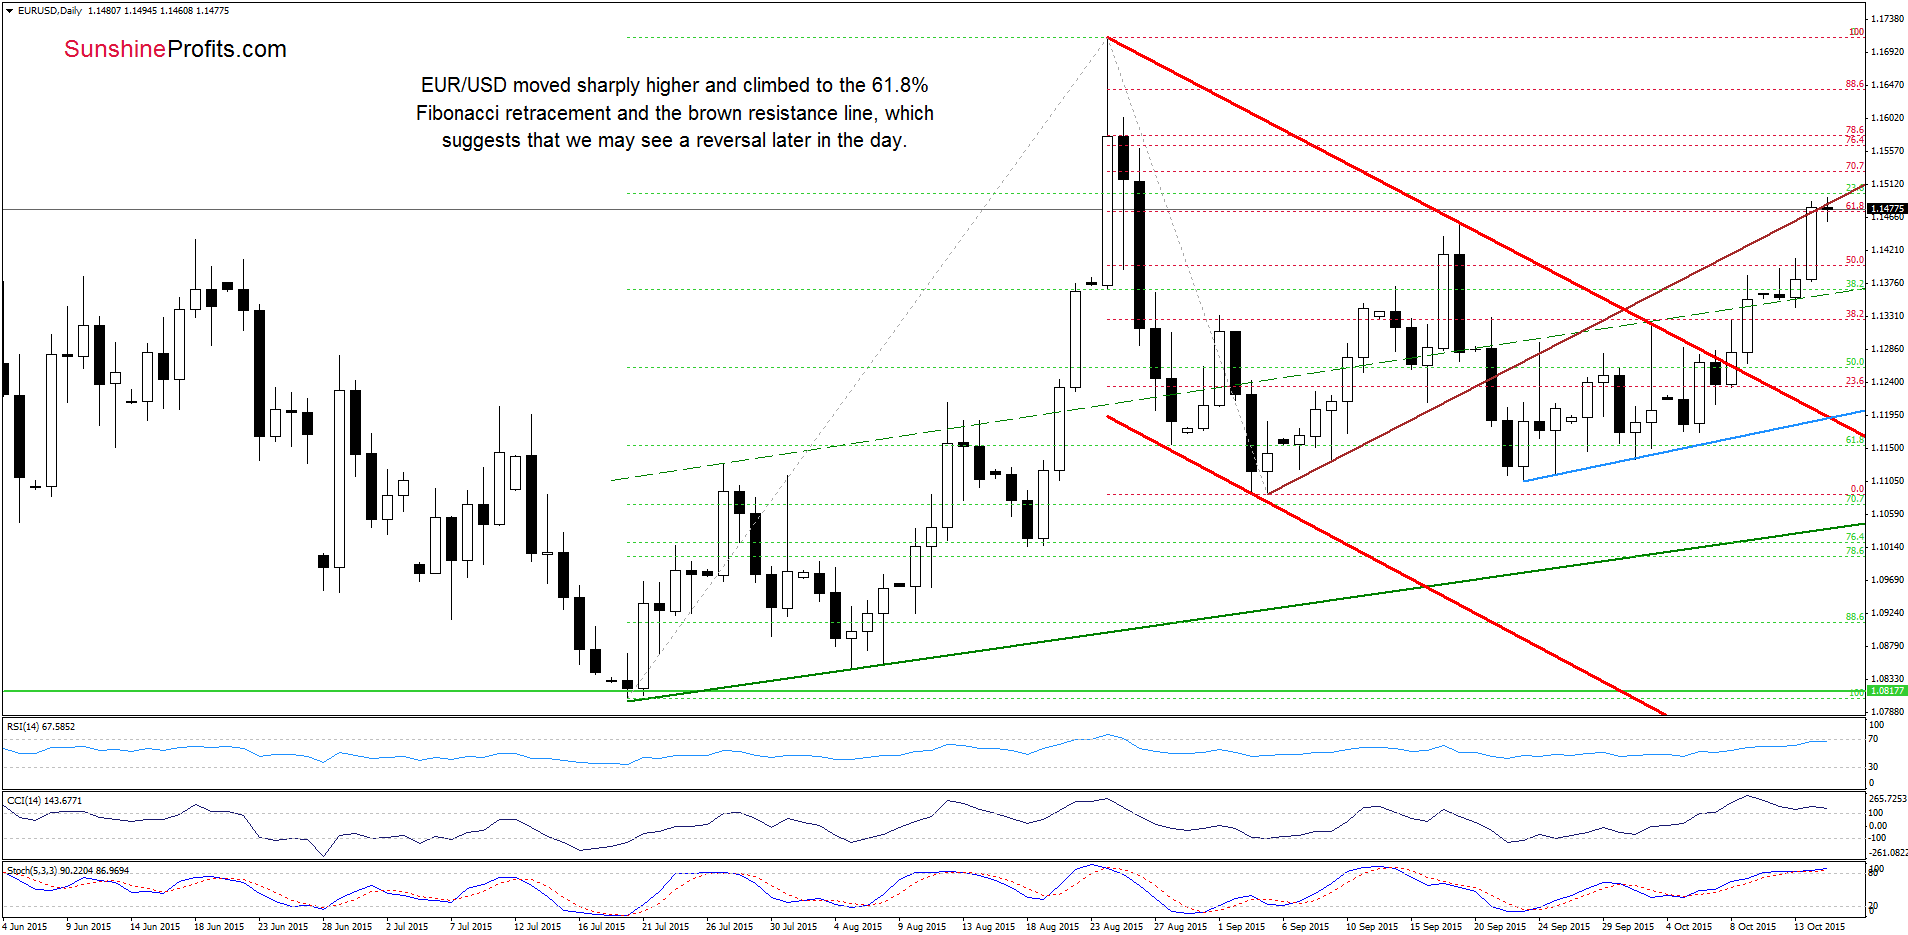
Looking at the daily chart, we see that EUR/USD extended gains above the barrier of 1.400 and the 50% Fibonacci retracement, which resulted in a rally to the 61.8% Fibonacci retracement and the brown resistance line. Taking into account these resistance levels and the current position of the indicators (a negative divergence between the CCI and the exchange rate, the Stochastic Oscillator above the level of 80) we think that reversal is more likely than not.
Very short-term outlook: bearish
Short-term outlook: bearish
MT outlook: mixed with bearish bias
LT outlook: mixed
Trading position (short-term; our opinion): Short positions with a stop-loss order at 1.1887 are justified from the risk/reward perspective. We will keep you informed should anything change, or should we see a confirmation/invalidation of the above.
USD/CAD
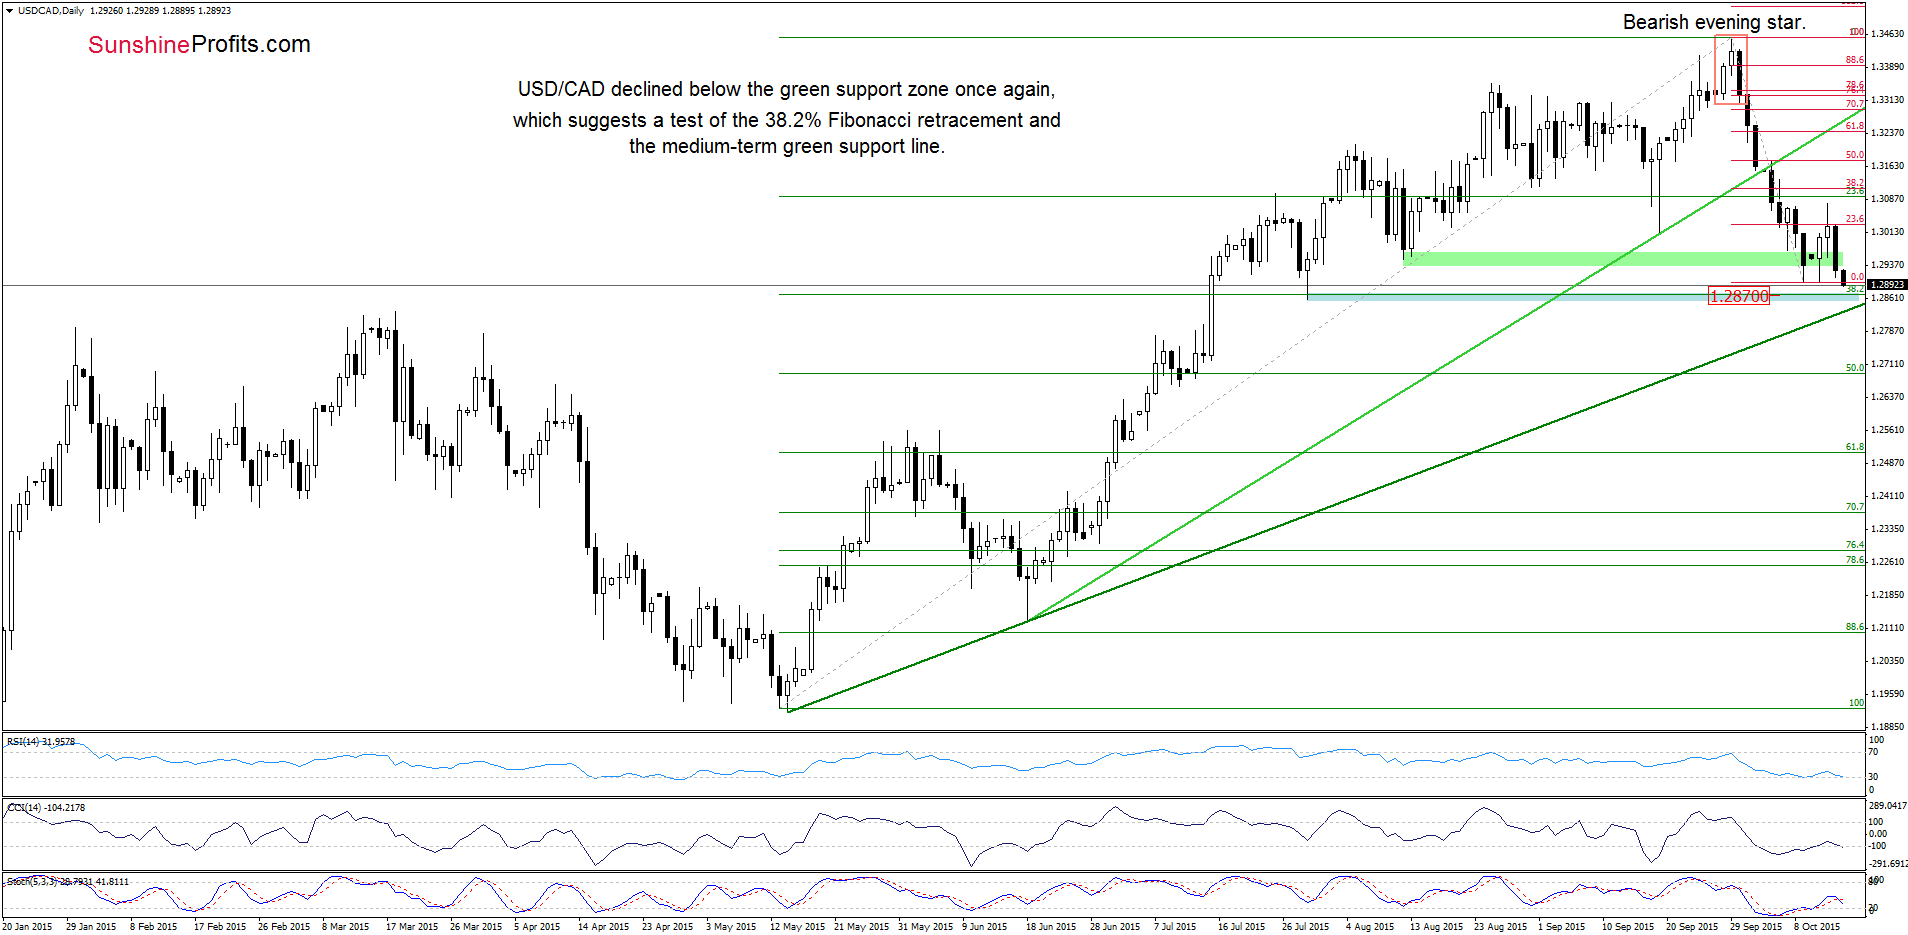
Looking at the daily chart, we see that although USD/CAD bounced off the green support zone, the 23.6% Fibonacci retracement (based on the recent decline) encouraged currency bears to act, which resulted in a drop to fresh Oct lows. Taking this negative signal into account, we think that we’ll see a test of the 38.2% retracement and the medium-term green support line (around 1.2833) in the coming day(s). If this support area withstands the selling pressure, USD/CAD will rebound to (at least) the Tuesday high; however, if it is broken, we may see a decline even to around 1.2691, where the next Fibonacci retracement is.
Are there any technical factors on the horizon that could push the pair higher or lower in the coming days? Let’s examine the weekly chart and find out.
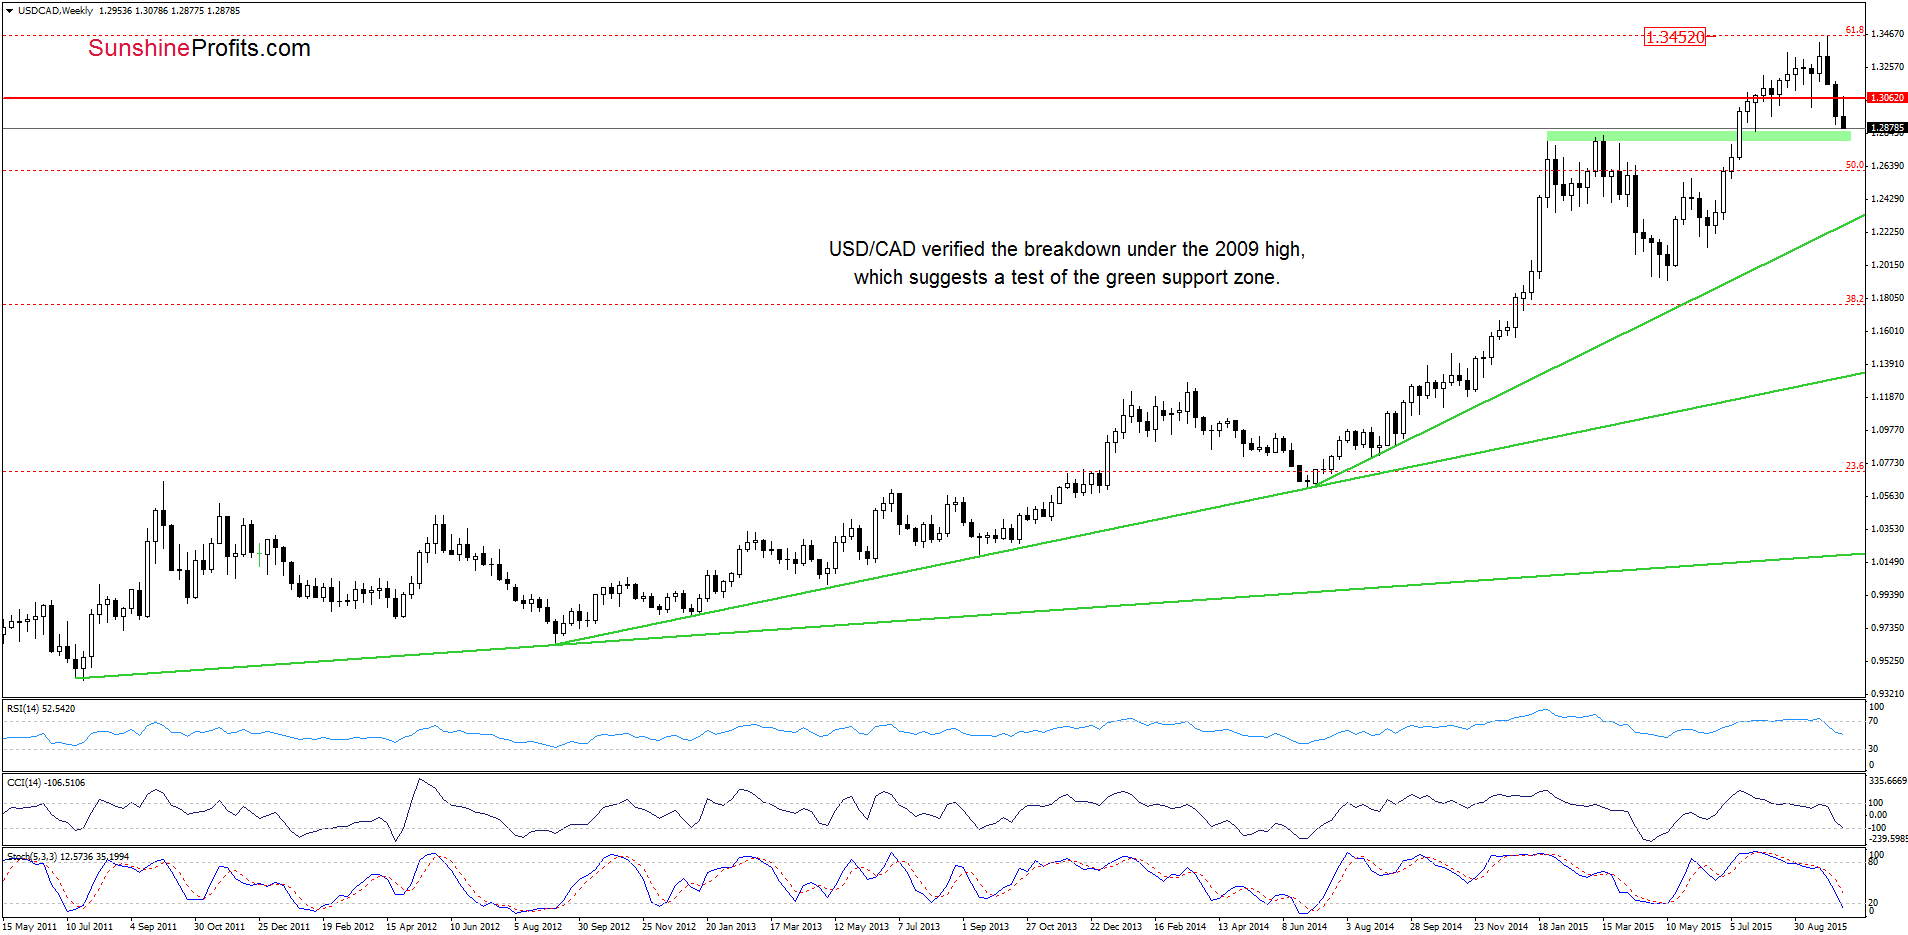
From this perspective, we see that USD/CAD verified the breakdown under the previously-broken resistance level based on the 2009 high, which triggered a reversal and resulted in lower values of the exchange rate. Nevertheless, as you see on the chart, the pair approached the green support zone (around 1.2797-1.2833), which could encourage currency bulls to act in near future.
Very short-term outlook: mixed
Short-term outlook: mixed
MT outlook: mixed
LT outlook: mixed
Trading position (short-term; our opinion): No positions are justified from the risk/reward perspective at the moment. We will keep you informed should anything change, or should we see a confirmation/invalidation of the above.
AUD/USD
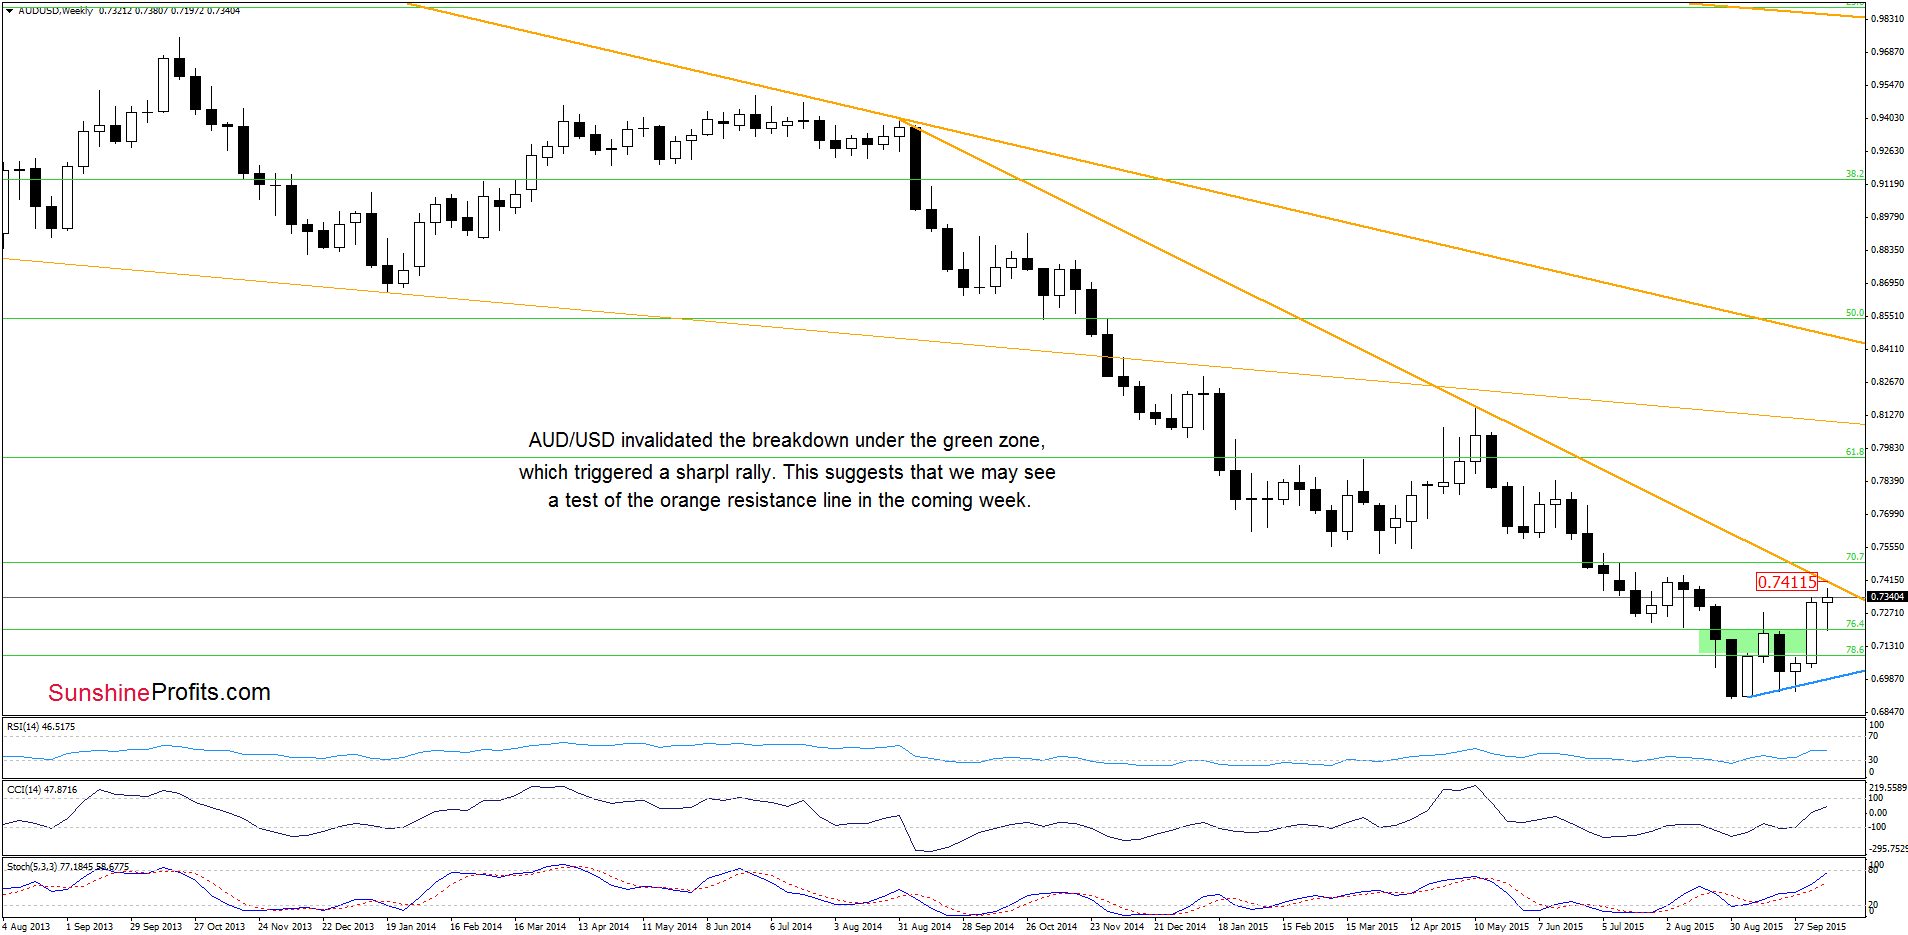
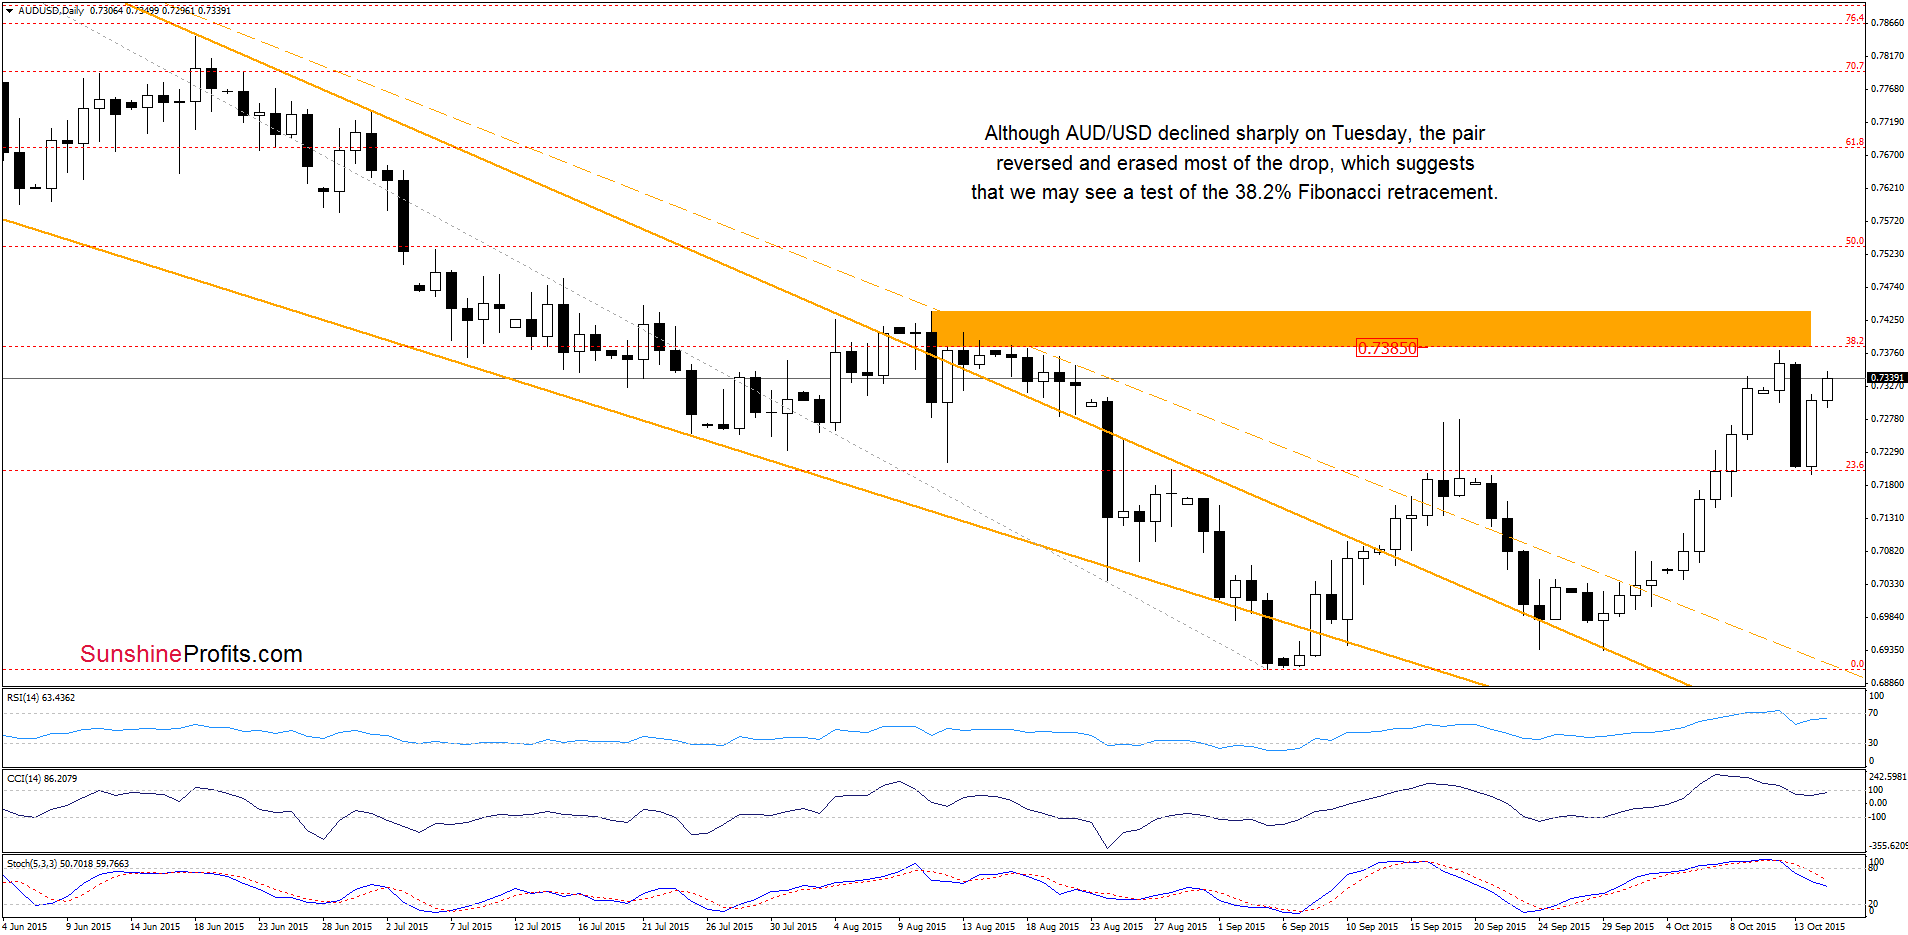
On Tuesday, AUD/USD reversed and declined sharply to the previously-broken 23.6% Fibonacci retracement. Despite this deterioration, the pair rebounded and erased most of this drop in the following days, which suggests that we may see further improvement and a test of the strength of the next Fibonacci retracement (around 0.7385) or even the orange resistance line marked on the weekly chart (around 0.7411) in near future.
Very short-term outlook: bullish
Short-term outlook: mixed with bullish bias
MT outlook: mixed
LT outlook: mixed
Trading position (short-term; our opinion): No positions are justified from the risk/reward perspective at the moment. We will keep you informed should anything change, or should we see a confirmation/invalidation of the above.
Thank you.
Nadia Simmons
Forex & Oil Trading Strategist
Przemyslaw Radomski, CFA
Founder, Editor-in-chief
Gold & Silver Trading Alerts
Forex Trading Alerts
Oil Investment Updates
Oil Trading Alerts
