

Forex Trading Alert originally sent to subscribers on July 23, 2015, 9:44 AM.
Earlier today, the U.S. Department of Labor showed that the initial jobless claims in the week ending July 18 dropped by 26,000 to 255,000, beating analysts’ expectations for a 1,000 drop. In this environment, the USD Index bounced off session’s lows and came back above 97. What impact did this move have on the euro, pound and Swiss franc?
In our opinion the following forex trading positions are justified - summary:
- EUR/USD: short (stop-loss order at 1.1058)
- GBP/USD: none
- USD/JPY: none
- USD/CAD: none
- USD/CHF: none
- AUD/USD: none
Before we take a closer look at the EUR/USD, GBP/USD and USD/CHF charts, let’s examine the current situation in the USD Index.
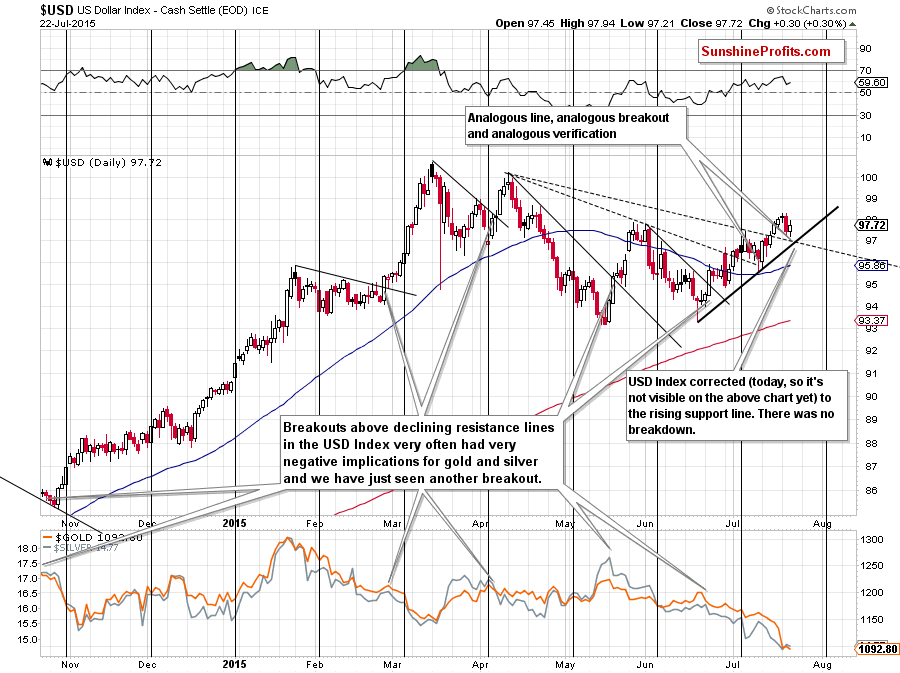
Yesterday, the index approached the black dashed line (based on the Apr 13 and Jul 7 highs), which triggered a rebound to slightly below 98. Earlier today, the U.S. dollar reversed and moved lower once again (it’s not visible on the above chart yet), re-testing not only this support line but also the black rising line based on the Jun 18 and Jul 10 lows (which serves as an additional support at the moment). What impact did it have on the greenback? The USD Index bounced off this area and came back above 97, which suggests higher values of the index – similarly to what we saw on Jul 13 (back then, the dollar moved sharply higher after a drop to analogous lines).
Having said that, let’s take a look at our currency pairs below.
EUR/USD
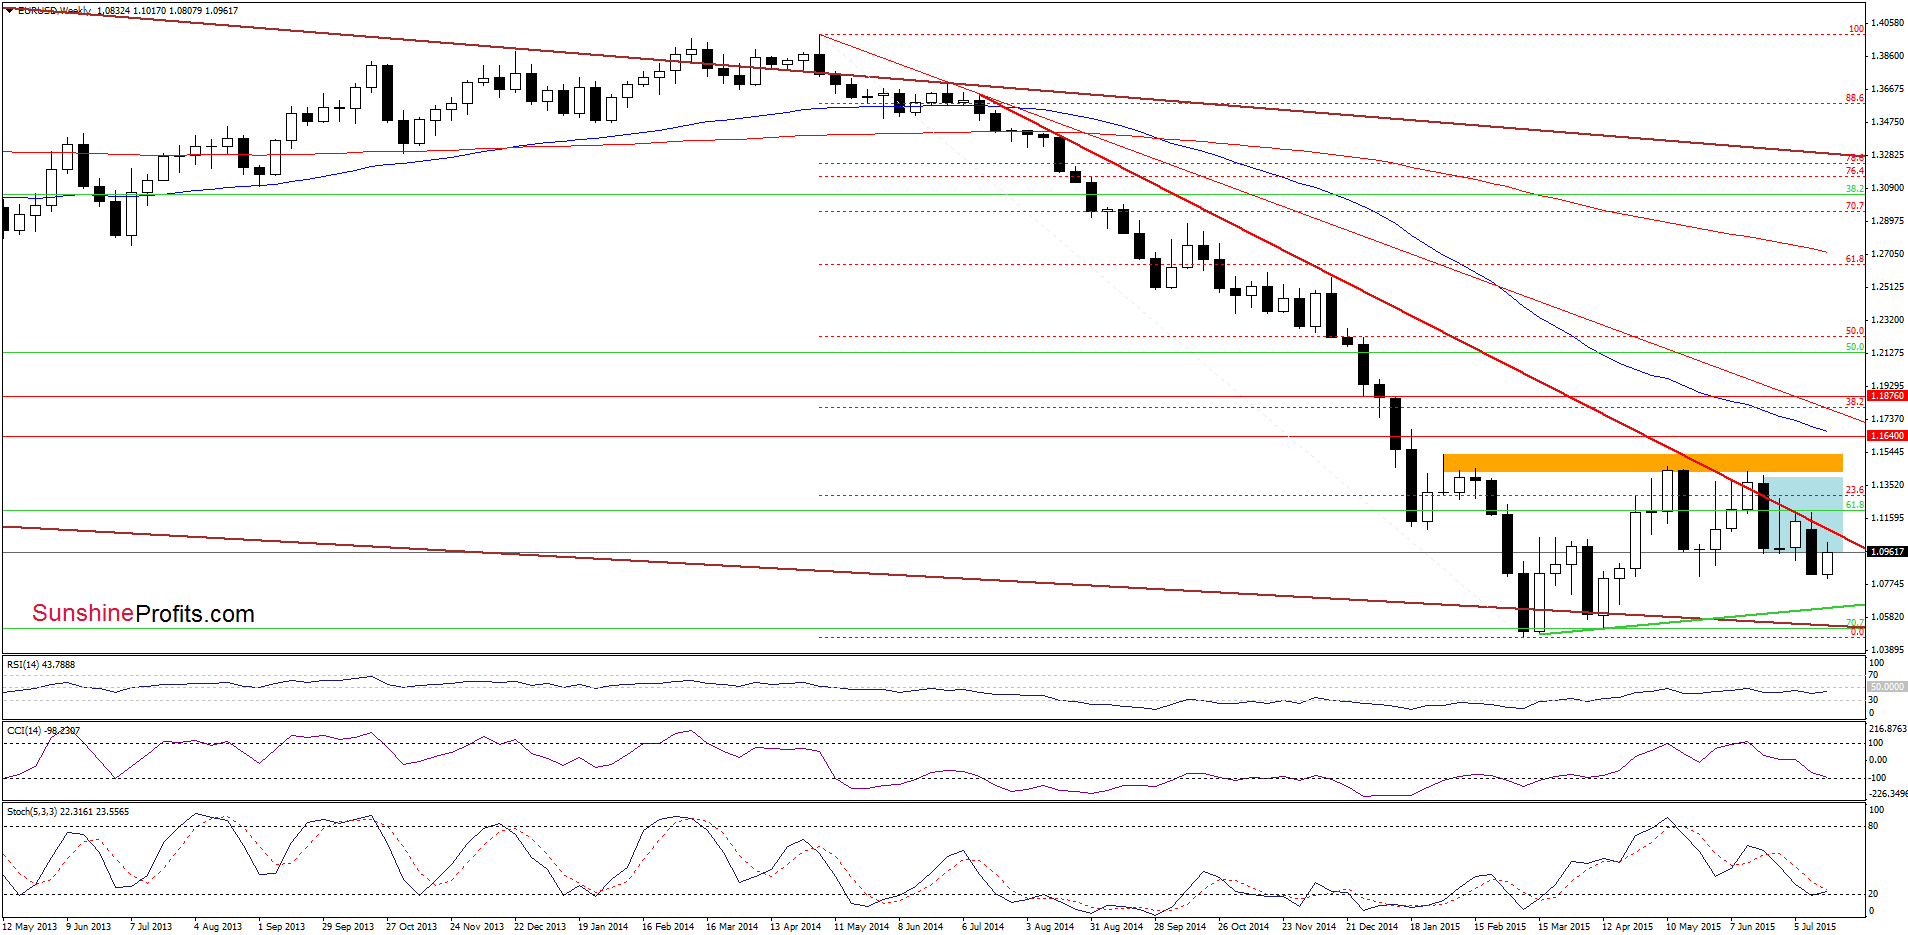
Although EUR/USD moved higher, the pair reversed and slipped under the lower border of the blue consolidation once again, which suggests that currency bulls may not be as strong as it seemed on the first sight.
Will the daily chart give us more clues about future moves? Let’s find out.
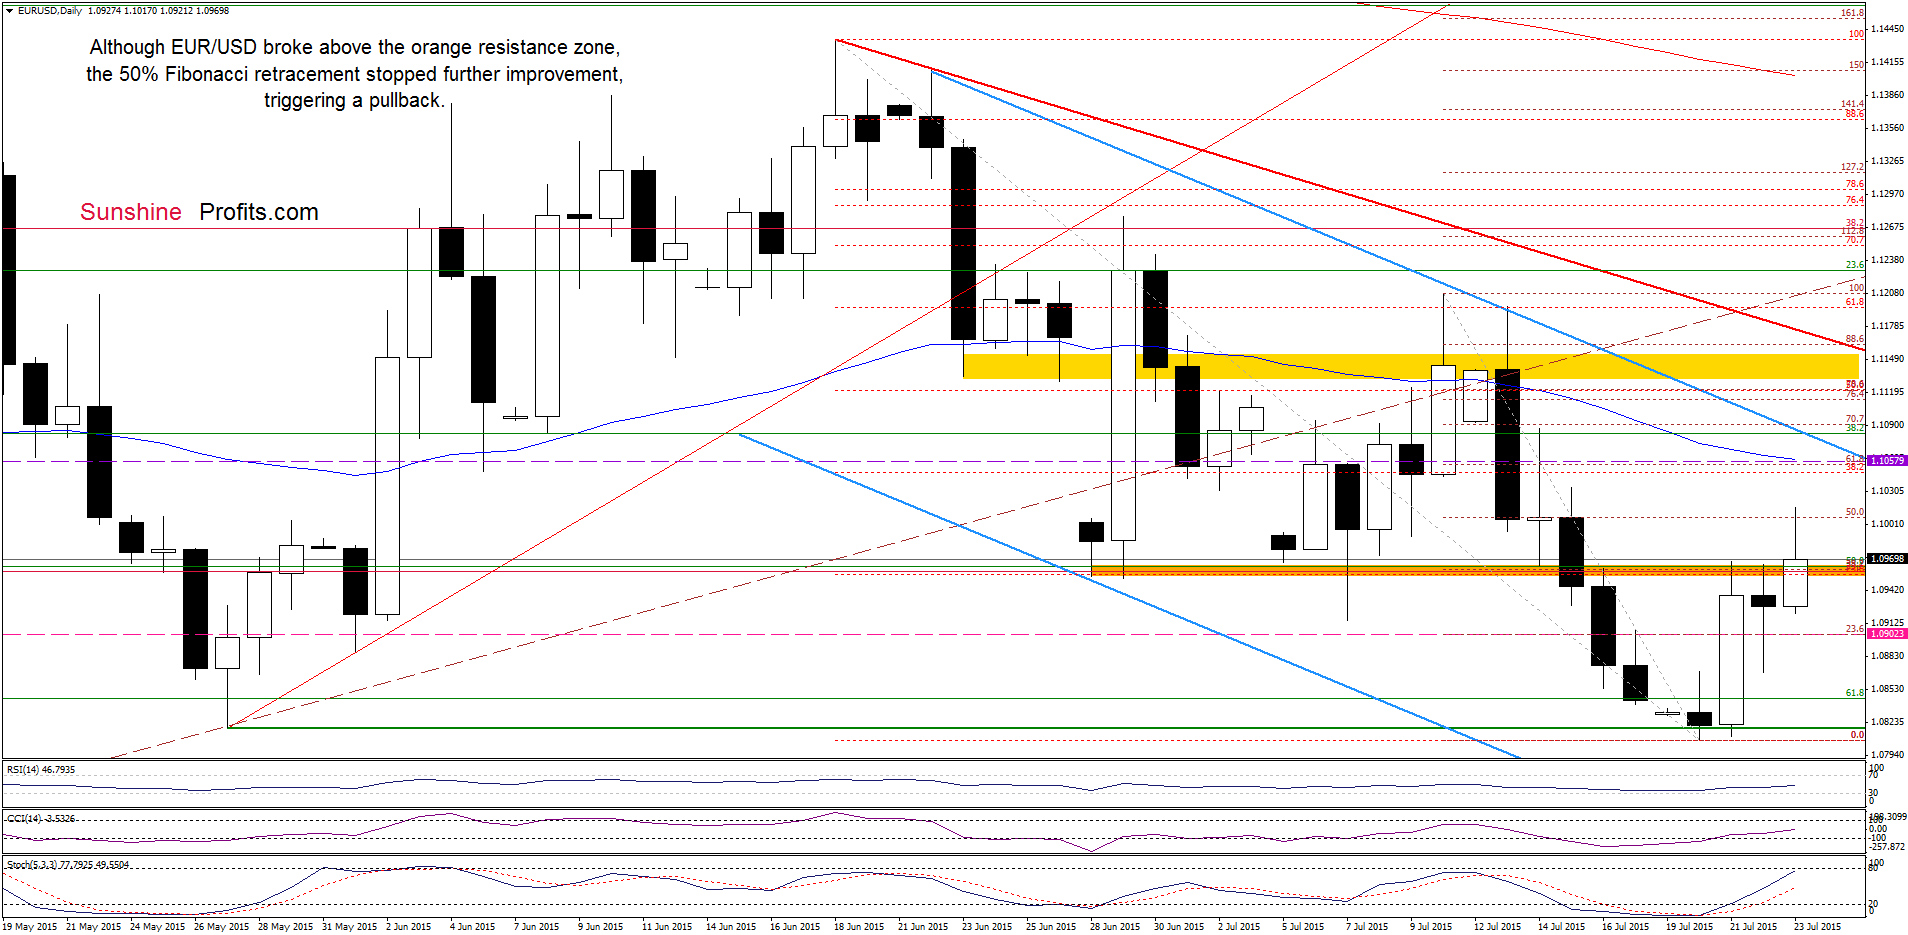
From this perspective, we see that EUR/USD broke above the orange resistance zone and reached the 50% Fibonacci retracement (based on the recent downward move started on Jul 10). Despite this improvement, currency bulls didn’t manage to push the pair higher, which resulted in a pullback to the previously-broken orange zone. What’s next? Although this area could trigger another rebound, we think that the current situation in the USD Index will translate to lower values of the exchange rate. If this is the case, and the pair closes today’s session under the orange area, it would be a bearish signal, which will trigger further deterioration in the coming days.
Very short-term outlook: bearish
Short-term outlook: mixed with bearish bias
MT outlook: mixed
LT outlook: mixed
Trading position (short-term; our opinion): Short positions with a stop-loss order at 1.1058 are justified from the risk/reward perspective at the moment. We will keep you informed should anything change, or should we see a confirmation/invalidation of the above.
GBP/USD
The situation in the medium term hasn’t changed much as GBP/USD is trading between the last week’s high and low. Today, we’ll focus on the very short-term changes.
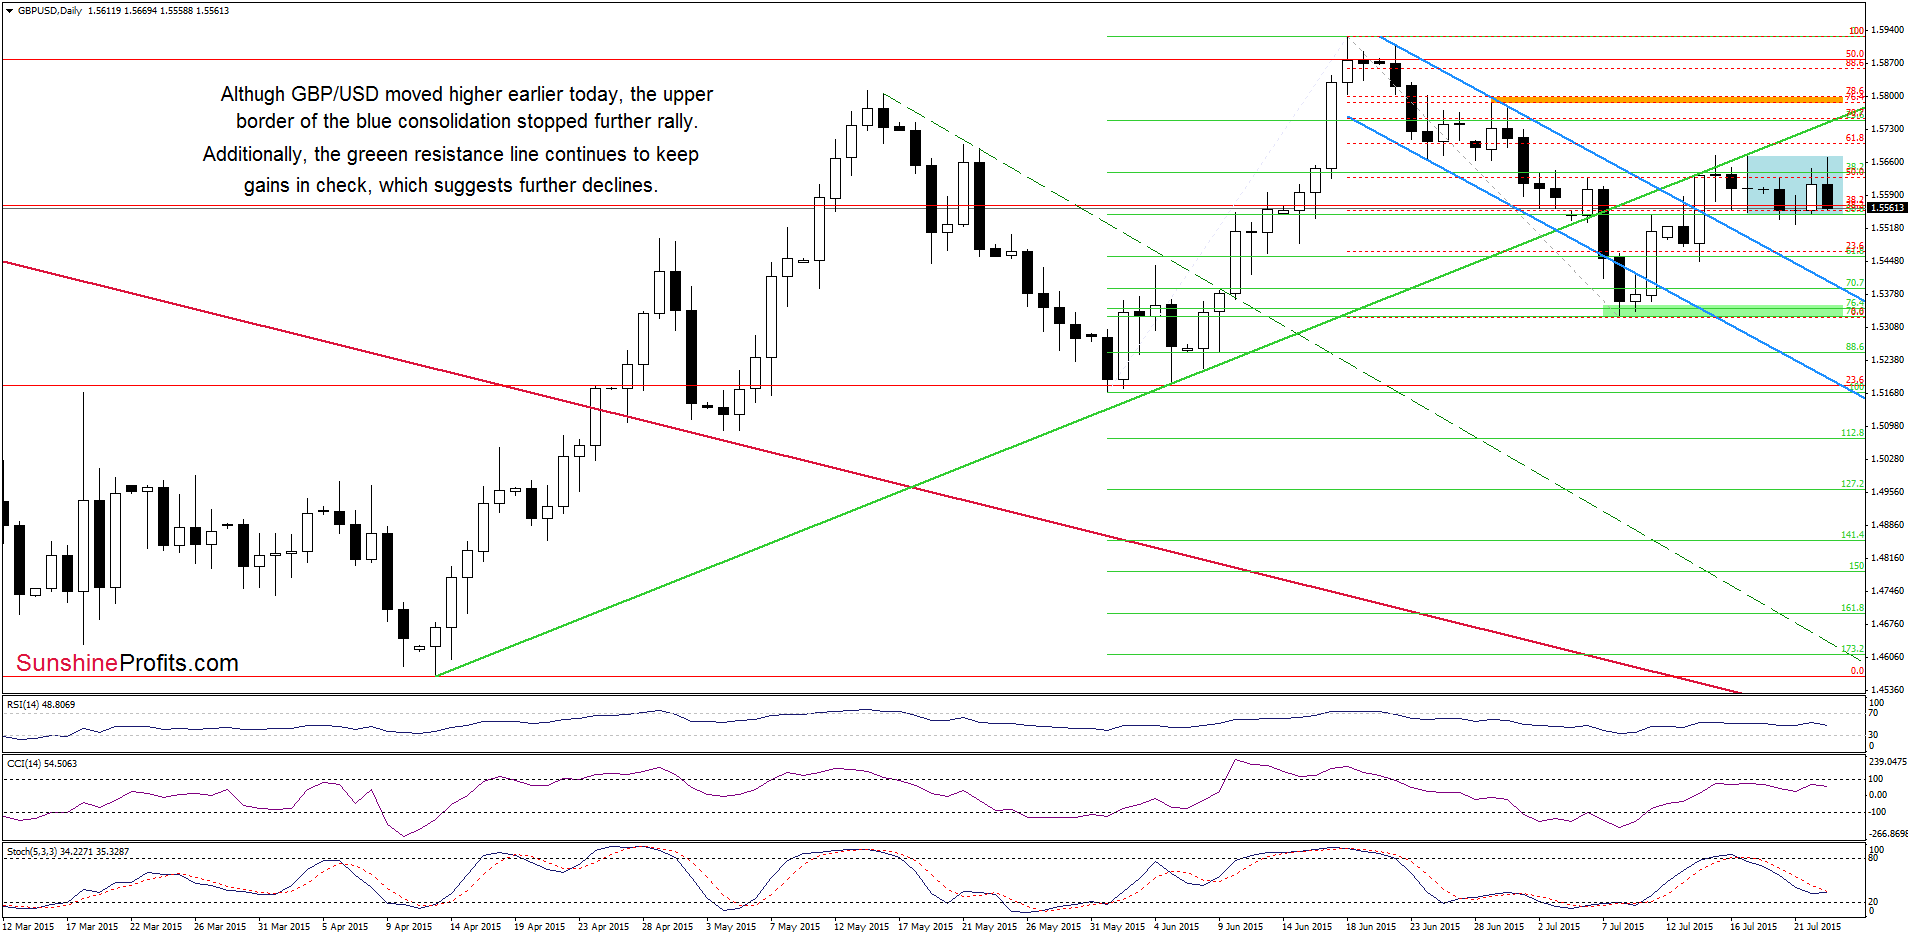
Looking at the daily chart, we see that although GBP/USD moved higher in the previous days, the upper border of the blue consolidation was strong enough to stop further improvement. As a result, the exchange rate moved sharply lower earlier today. What’s next? If the pair drops below the lower border of the blue consolidation, GBP/USD will likely extend losses and we’ll likely see a decline to the previously-broken upper border of the declining blue trend channel (currently around 1.5408) in the coming days.
Very short-term outlook: mixed with bearish bias
Short-term outlook: mixed
MT outlook: mixed
LT outlook: mixed
Trading position (short-term; our opinion): No positions are justified from the risk/reward perspective at the moment. We will keep you informed should anything change, or should we see a confirmation/invalidation of the above.
USD/CHF
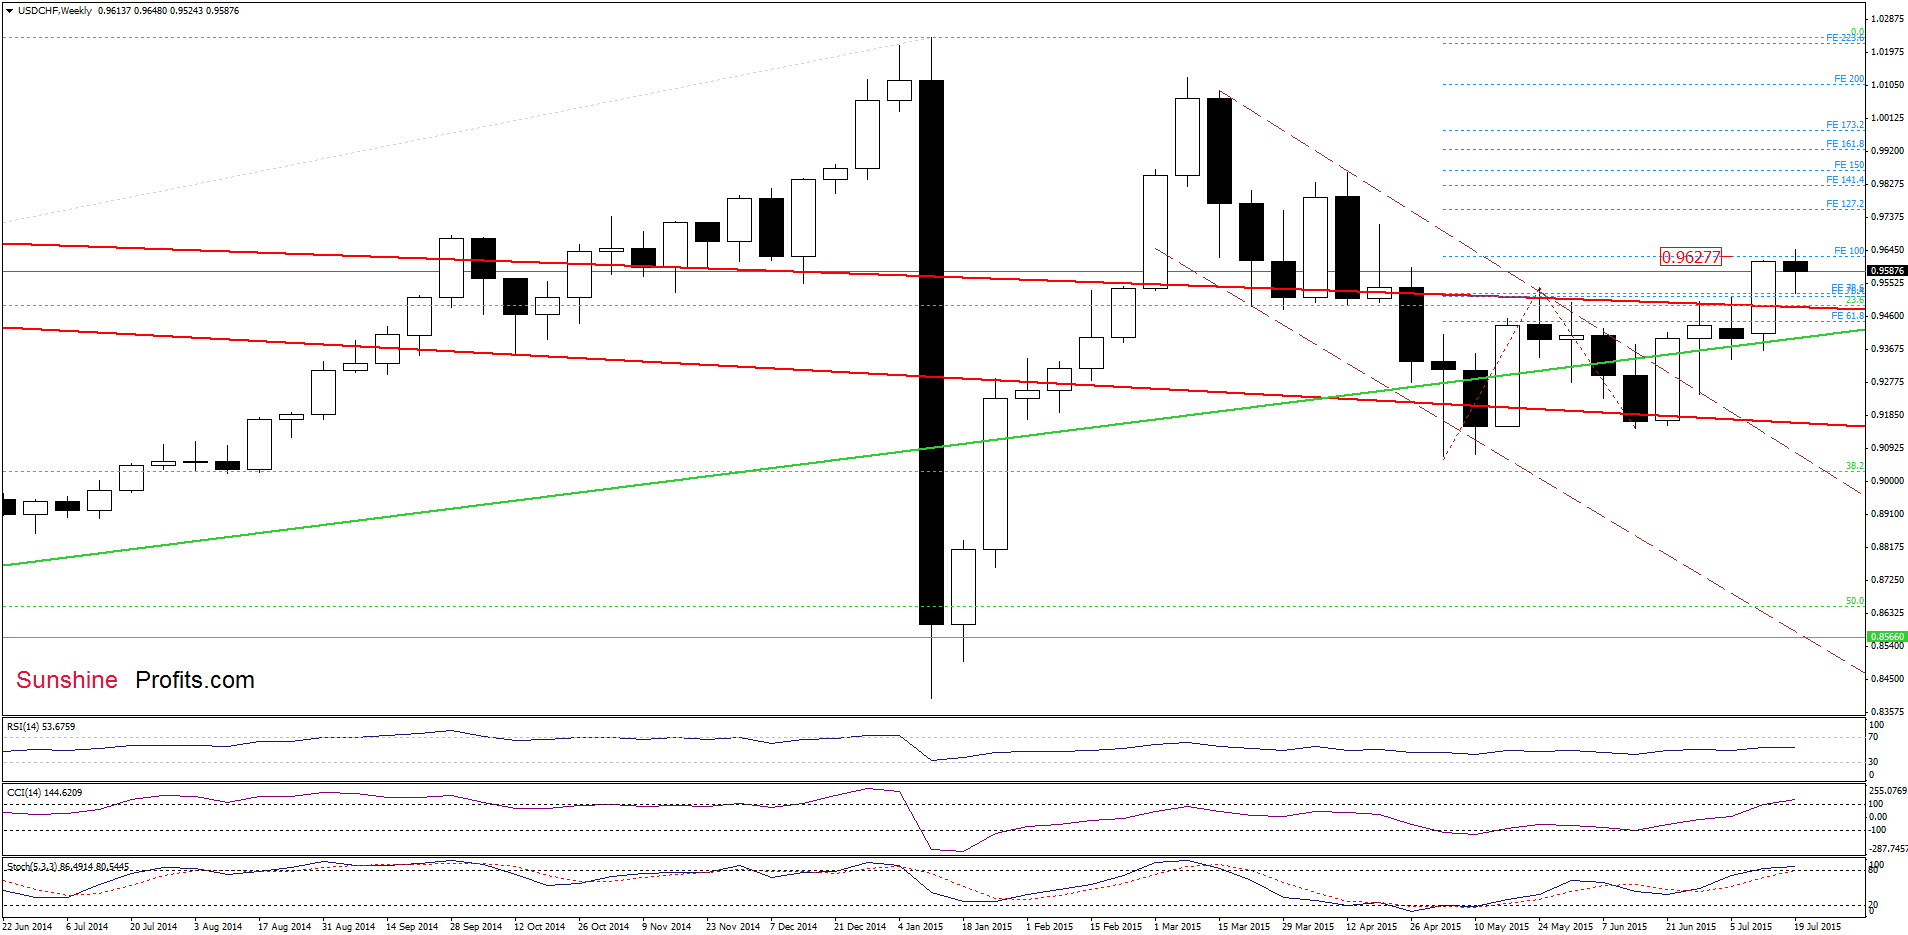
The situation in the medium term has deteriorated slightly as USD/CHF reversed and declined after an increase above the 100% Fibonacci price projection (marked with blue). What impact did this move have on the very short-term picture? Let’s check.
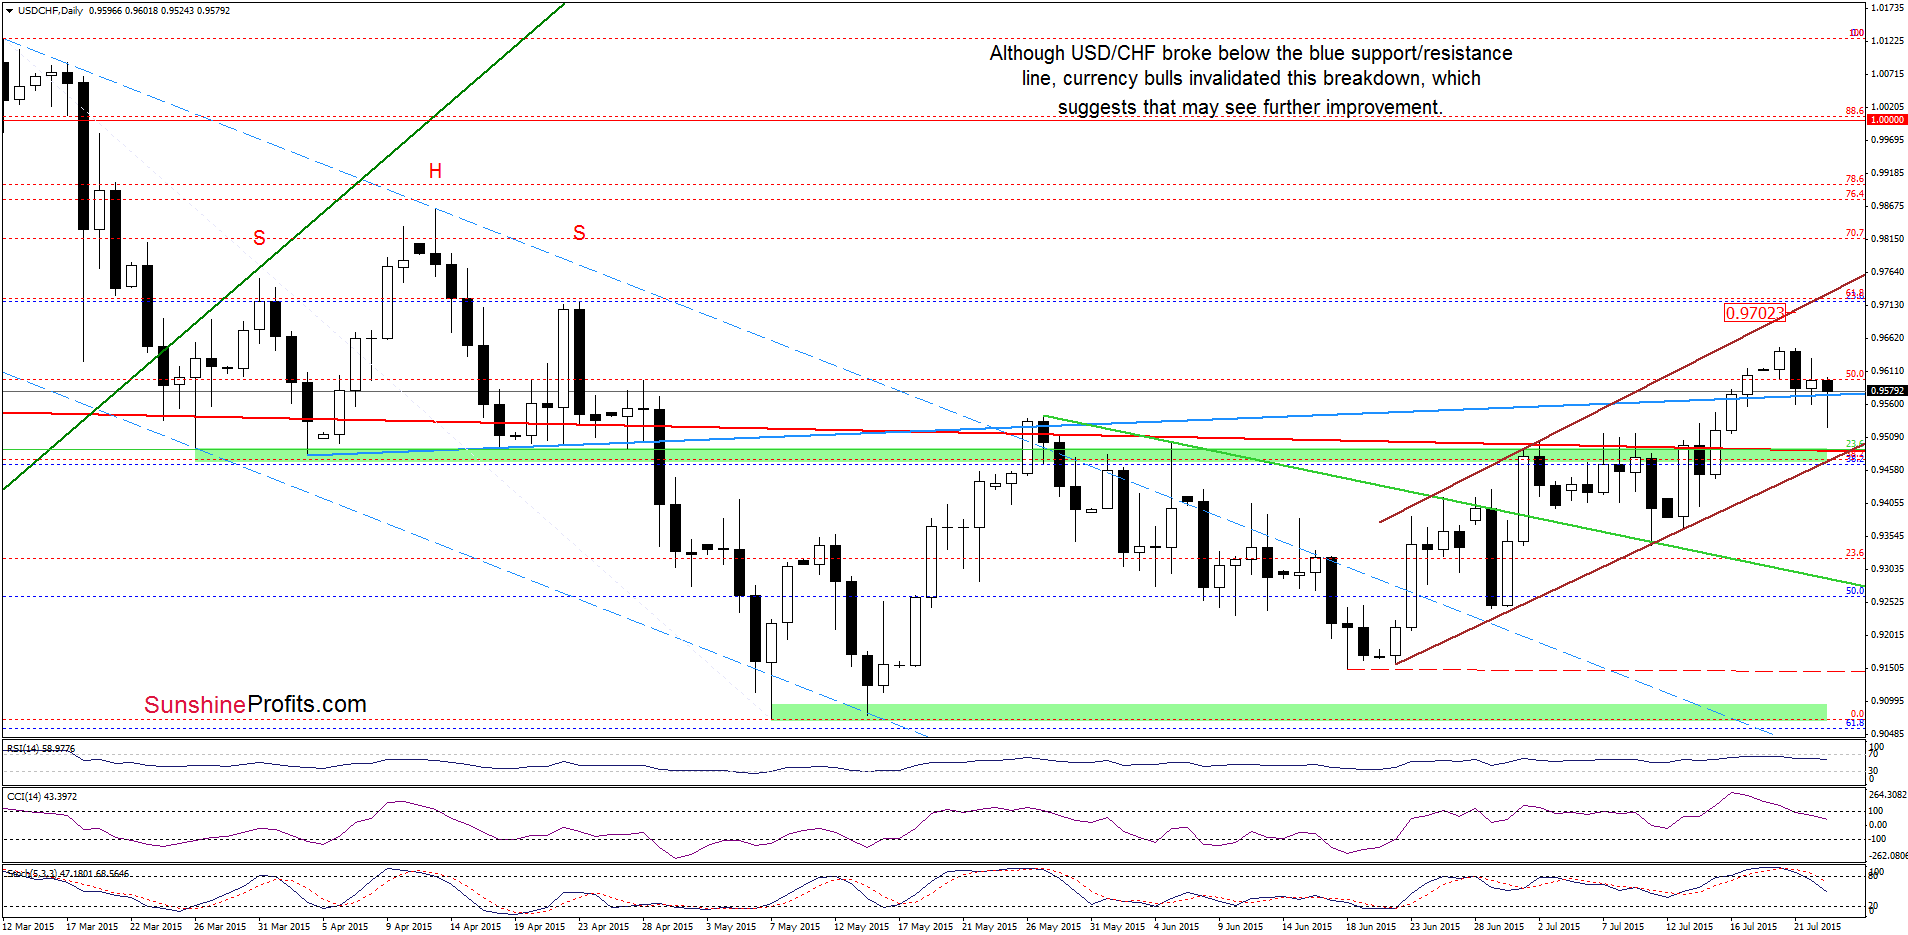
On the above chart, we see that USD/CHF moved lower in recent days, which resulted in a drop below the previously-broken blue support/resistance line. Despite this move, currency bulls managed to stop their opponents and the pair rebounded earlier today. With this upswing, the pair invalidated small breakdown under the blue line, which is a positive signal that suggests further improvement. Nevertheless, such price action will be more likely (and reliable), if we see a daily close above the blue line (currently at 0.9575).
Very short-term outlook: mixed
Short-term outlook: mixed
MT outlook: mixed
LT outlook: mixed
Trading position (short-term; our opinion): No positions are justified from the risk/reward perspective at the moment. We will keep you informed should anything change, or should we see a confirmation/invalidation of the above.
Thank you.
Nadia Simmons
Forex & Oil Trading Strategist
Przemyslaw Radomski, CFA
Founder, Editor-in-chief
Gold & Silver Trading Alerts
Forex Trading Alerts
Oil Investment Updates
Oil Trading Alerts
