
If you registered prior to Feb 17-th 2009 and this is the first e-mail that you receive from us, then it means that our previous messages have not reached you, due to the technical problems that we have encountered. You may view copy of the recently sent messages here: http://www.sunshineprofits.com/?q=list/commentary . Until I am sure that we have solved the e-mail deliverability problem I will send you messages in the text format, as they are more likely to reach you. We apologize for not having narrowed down the problem earlier.
In the previous Market Update, and in my latest essay, I have stated that we will most likely see lower precious metals prices in the coming days. This has indeed taken place and this Market Update is being sent in order to let you know how I plan to deal with the current situation.
Let's begin with the chart (most charts courtesy of stockcharts.com) of the GDX ETF, which is being used as a proxy for PM stocks.
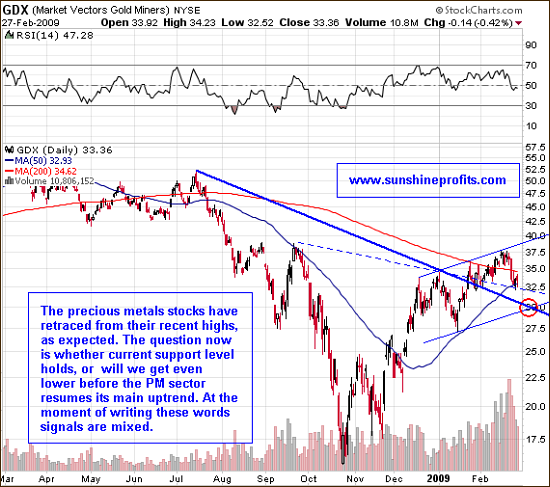
The precious metals stocks have corrected and are now at the minor support level, which is combination of a minor trend line and 50-day moving average. The drop here was rapid, but most corrections need more time to complete than just a few days. Knowing that PM stocks often correct in the zig-zag (or a-b-c-) fashion ( http://www.tradersedgeindia.com/images/ew10.gif ), we can infer that the precious metals stocks will experience another small decline. That would ideally correspond to the $30 GDX level or HUI at 250-260. In order to confirm this initial assumption, let's take a closer look:
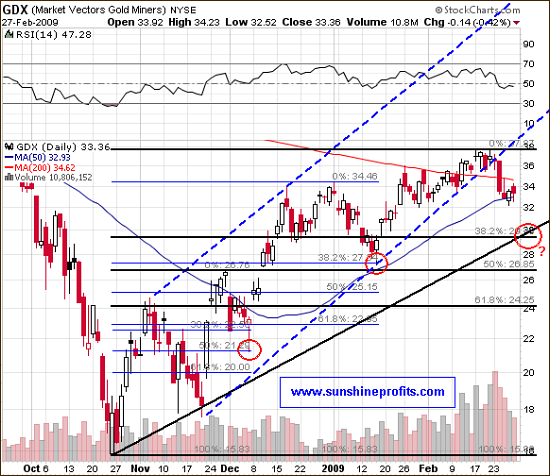
Fibonacci retracement levels have so far (during this rally) proven a very good indication of where the correction will ultimately end - please take a look at the areas marked with red circles. This does not mean that this particular tool is perfect, but it seems that it is currently one of the best that we can use. For this correction the first retracement level is just under the previously mentioned $30 level. The second one corresponds to the previous local low around the $27 level. Should the first retracement level not hold PM stocks, the second one (-50%) will most likely do.
However, at the moment the first retracement still seems to be the most probable level this price could go. On the other hand, there is one more thing that needs to be taken into account, and that is the signal that our indicators have just given.
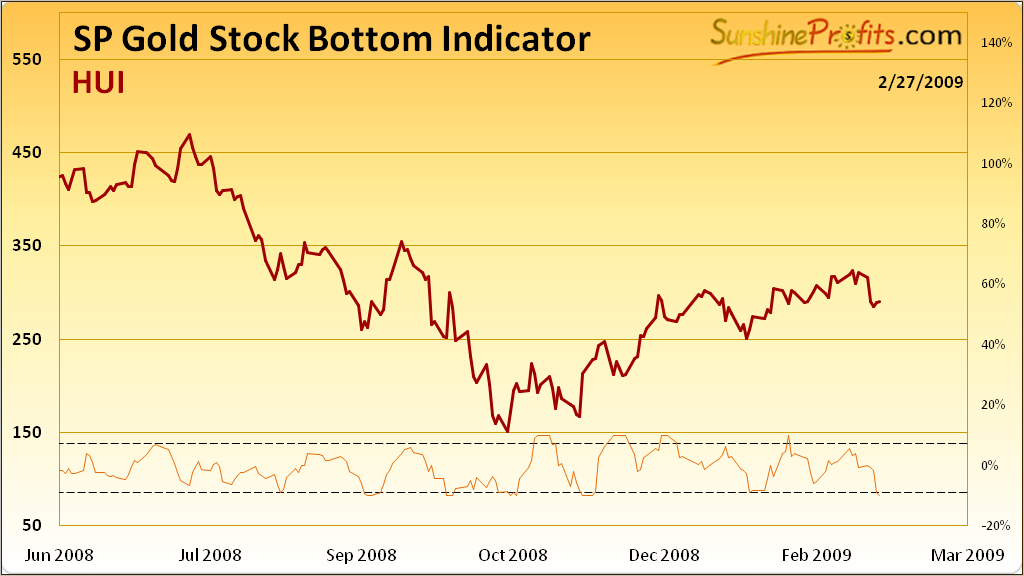
(The buy signal is given, when indicator breaks upper or lower dashed line, in any direction)
As you may see, this indicator has just signaled a bottom. Because other factors point to lower PM stock prices, I will not engage in a speculative transaction in the PM sector, as the risk / reward situation is not yet extremely appealing.
Let me digress here - my previous update/essay was not a call to sell your long-term holdings, but if you have interpreted it this way, reentering the market at today's price is not a bad idea in my opinion.
Another factor that needs to be considered here is the recent performance of the general stocks market. It is again testing the critical support level and with all the negativity in the media right now it is likely that it will not be broken. This is generally positive for gold stocks and especially for silver stocks, as the general stock market has a short-term impact on prices of PM stocks.
Generally, rising stock market has been lately a positive environment for PM shares. However, very recently gold and silver stocks managed to rise even despite declining stock indices. This has been most likely caused by investors who purchased precious metals stocks as a hedge against falling stock market. In other words, very recently PM stocks and the general stock market became negatively correlated. I expect this to change in the not too distant future, but at the moment this tendency remains in place. Therefore, if the general stock market does indeed bounce from here, this could serve as a catalyst the second downleg of this correction in the PM stocks that I previously referred to.
Bouncing world stock market indices have particularly positive implications for base metals, and for silver, because of its industrial part of demand. The technical picture for the white metal is also favorable.
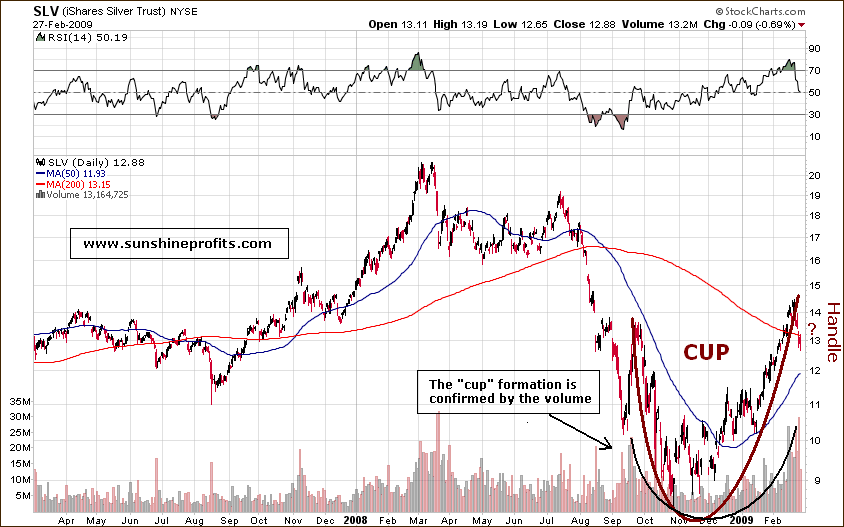
As mentioned on the above chart, silver has formed one of the most bullish formations cup with (small) handle. The longer the "cup" forms and more symmetric and U-shaped it is, the stronger the buy signal is. The above "cup" has been forming for about 5 months, which is quite long, at least for a short, to medium-term trading signal. Right now the "handle" is just being created. It's a tough call to say how low can it go temporarily, but $11-$12 is not out of the question. However what is most important here is not how low it will go temporarily, but rather what happens after the handle is complete. The "cup and handle" formation is a powerful pattern that usually sends the price of a particular asset much higher, once the "handle" is complete. Please consider the enormous "cup" that formed from 1996 to 2004. The massive multi-year rally that followed took gold much more than 100% higher.
Summing up, if you don't own silver yet, I would not wait too long to make my purchase.
Before you ask - yes, I do believe the abovementioned factors create a speculative opportunity. High (topping?) value of the U.S. dollar, bottoming general stock market create a positive environment for commodity stocks. Moreover, this sector has on average refused to go any lower despite negative influence from both USD and general stock market. But wait, there's more good news - the aforementioned "cup and handle pattern" can be seen in several stocks from the sector. I believe the best example here is Rio Tinto (symbol: RTP) - please take a look for yourself: http://stockcharts.com/h-sc/ui?s=rtp . I am therefore purchasing call options on RTP (diversified) and FCX (copper and gold).
Details (in the Premium Service you will see how I calculate these shares):
RTP:
March 110 calls 4% of my speculative capital
April 110 calls 3% of my speculative capital
FCX:
March 30 calls 3% of my speculative capital
April 35 calls 3% of my speculative capital
Please remember to speculate only with money that you can afford to lose.
To help us deliver you these updates please add to your address book / "safe sender list" in your e-mail client. Before you ask, the Premium Service will most likely (hopefully) be available within a week or so.
Sincerely,
Przemyslaw Radomski
Free Stocks & Gold Newsletter
with details not available
to 99% investors
+ 7 days of Gold Alerts
