

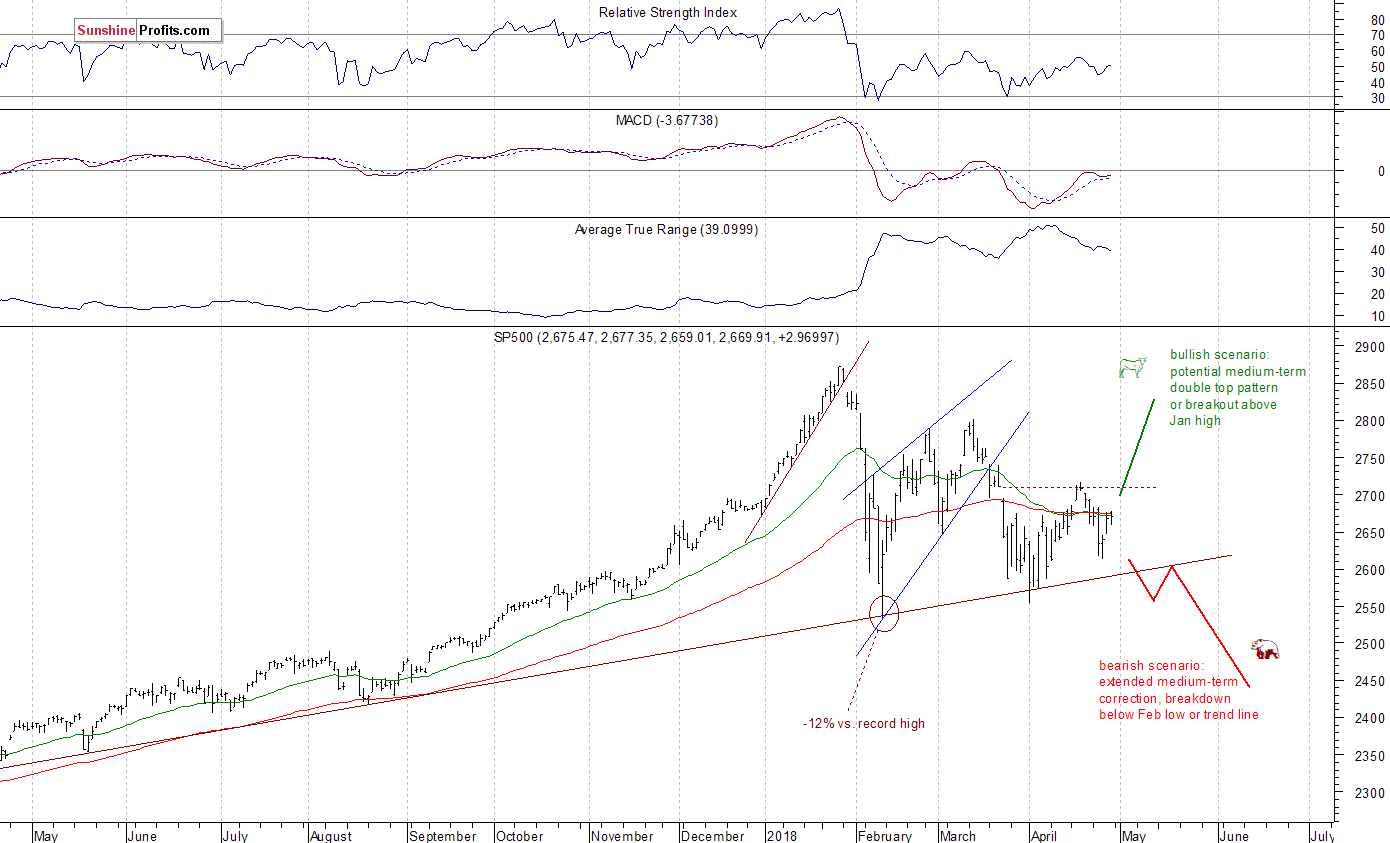
The U.S. stock market indexes were mixed between -0.1% and +0.1% on Friday, as investors hesitated despite better-than-expected quarterly corporate earnings releases. The S&P 500 index fluctuated following Thursday's move up. It currently trades 7.1% below January 26 record high of 2,872.87. The Dow Jones Industrial Average lost 0.1% and the technology Nasdaq Composite was unchanged on Friday.
The nearest important level of resistance of the S&P 500 index is at 2,680-2,685, marked by previous local highs. The next resistance level is at 2,695-2,710, marked by March 22 daily gap down of 2,695.68-2,709.79. The resistance level is also at 2,740. On the other hand, support level is at around 2,745-2,750, marked by Thursday's daily gap up of 2,645.30-2,647.16. The level of support is also at 2,610-2,615, marked by recent local low.
The broad stock market bounced off its medium-term upward trend line again. Stocks extend their over two-month-long consolidation following early February sell-off. Is this a bottoming pattern before another leg higher within the long-term bull market? Or just pause before another wave of selling? So, there are still two possible future scenarios - bearish that will lead us below February low following trend line breakdown, and the bullish one in a form of medium-term double top pattern or breakout towards 3,000 mark:
Positive Expectations Again
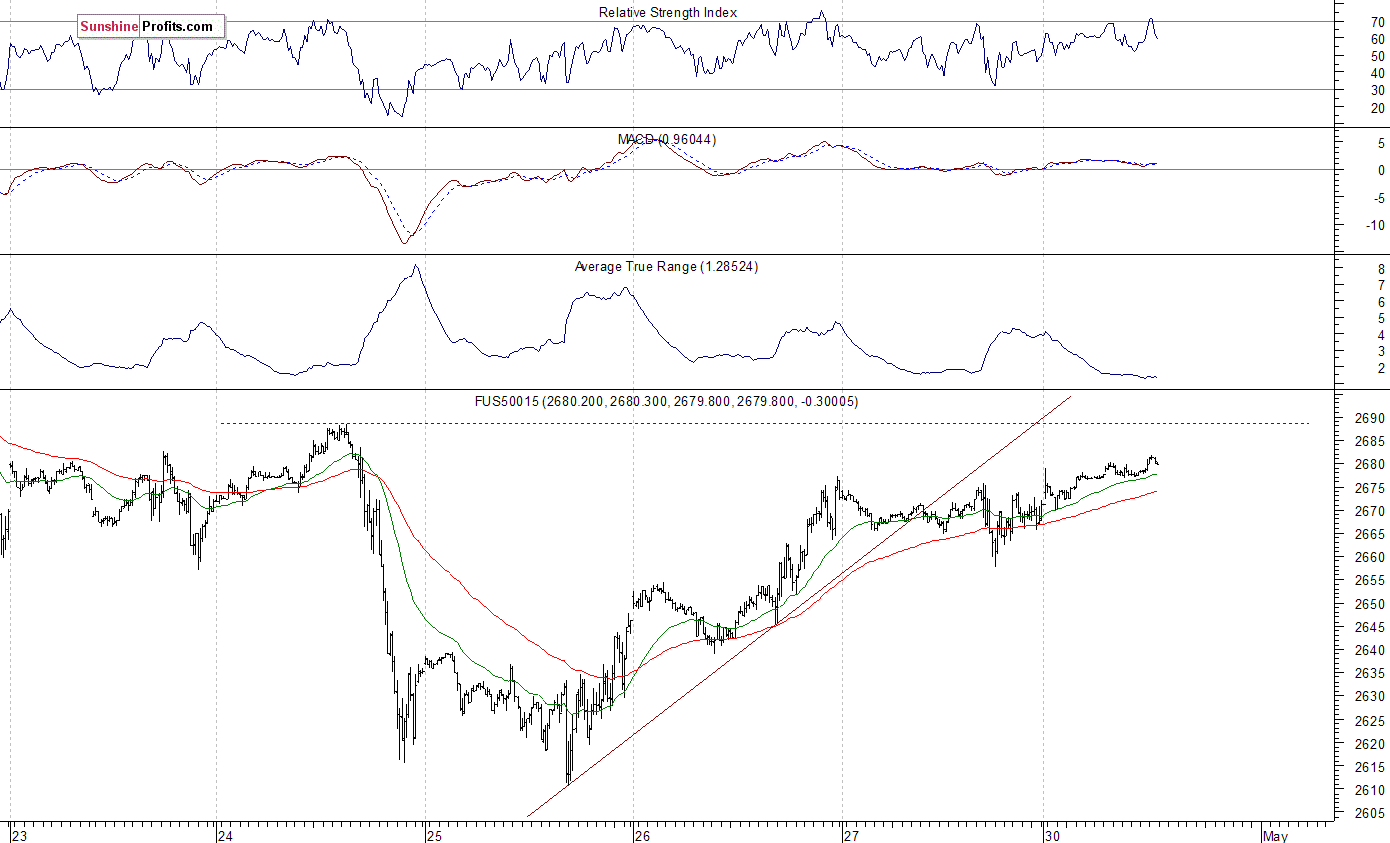
The index futures contracts trade 0.3-0.5% higher vs. their Friday's closing prices. So, expectations before the opening of today's trading session are positive following Friday's indecision. The main European stock market indexes have gained 0.2-0.5% so far. Investors will now wait for some economic data announcements: Personal Income, Personal Spending, Core PCE Price Index at 8:30 a.m., Chicago PMI at 9:45 a.m., Pending Home Sales number at 10:00 a.m. Investors will also wait for more quarterly earnings releases. The S&P 500 index may extend it short-term consolidation just below the level of 2,700. We may see some positive "window dressing" action, because of the last day of a month.
The S&P 500 futures contract trades within an intraday uptrend, as it extends its overnight move up. The nearest important level of resistance is at around 2,685-2,690, marked by previous local high. The next resistance level is at 2,695-2,700. On the other hand, support level is at 2,660-2,665, marked by some recent local lows. The next level of support is at 2,650, among others. The futures contract gets closer to its previous local high, as the 15-minute chart shows:
Nasdaq Back at 6,700 Mark
The technology Nasdaq 100 futures contract follows a similar path, as it trades within an intraday uptrend. However, it retraces a part of its Friday's intraday move down. The market broke below the level of 6,700, and got closer to support level of 6,550-6,600 on Friday. The nearest important level of resistance is now at 6,740-6,770, marked by local highs. We still can see an increased volatility. The Nasdaq futures contract trades along its short-term upward trend line, as we can see on the 15-minute chart:

Apple One Day Before Earnings, Amazon Sold Off New Record High
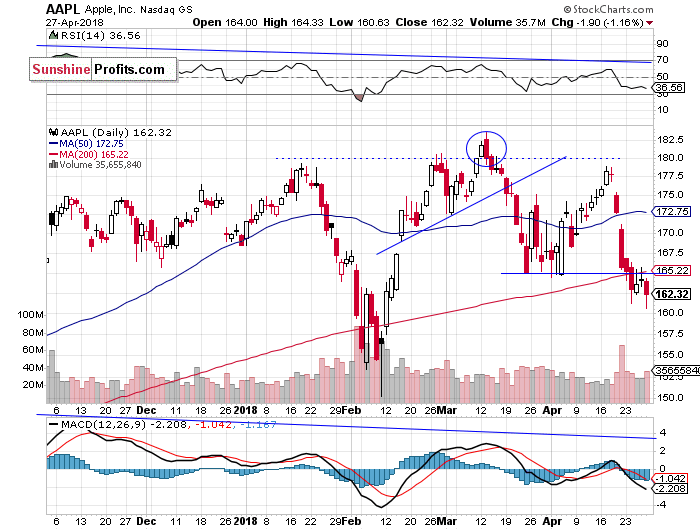
Let's take a look at Apple, Inc. stock (AAPL) daily chart (chart courtesy of http://stockcharts.com). It reached a new short-term low on Friday, following technology sector intraday move down. However, it remains at support level of around $160-165. Apple will release its earnings report tomorrow after-hours and we will likely see some more clear reaction. Probably to the upside, as there seems to be some "sell the rumor, buy the fact" action going on:
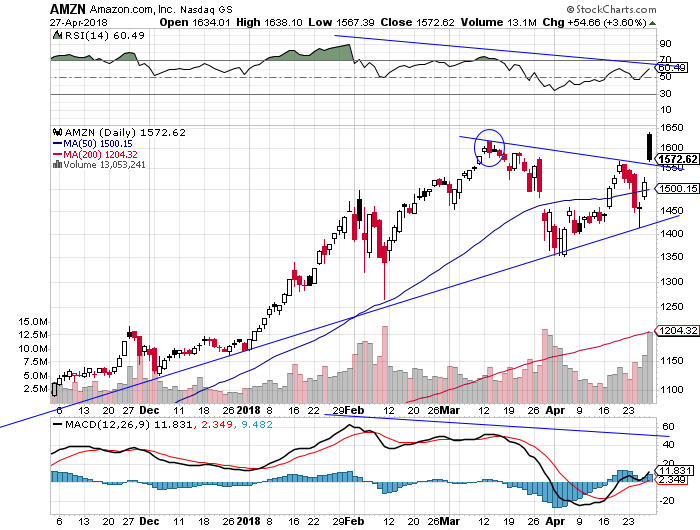
Now let's take a look at Amazon.com, Inc. stock (AMZN) daily chart. The price reached new record high on Friday morning, as investors reacted to better-than-expected quarterly earnings release. Then it sold off below $1,600. Is this a downward reversal or just correction following breakout higher? If the price breaks below support level of around $1,550, we could see more selling pressure. For now, it looks like a downward correction:
Dow Jones Continues Sideways
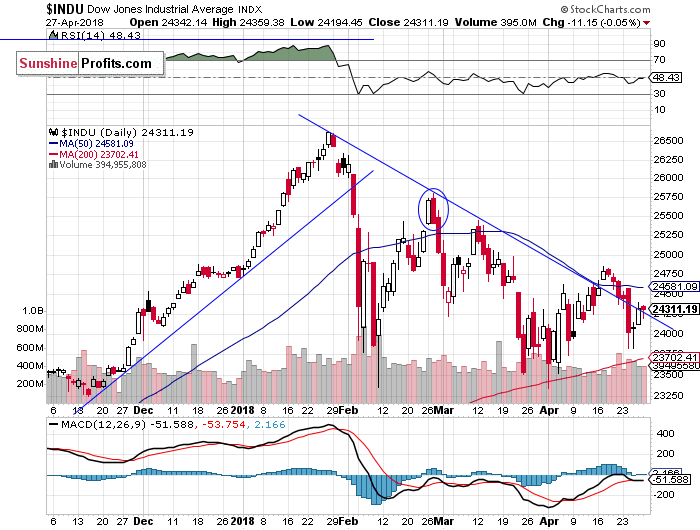
The Dow Jones Industrial Average continues to trade along its medium-term downward trend line following last week's Tuesday's breakdown below that line. The price bounced off resistance level of around 24,800-25,000 two weeks ago. Will it resume its uptrend after a downward correction? The support level remains at around 23,800-24,000. The blue-chip index extends its medium-term fluctuations:
The broad stock market retraced most of its last week's Tuesday's move down on Thursday. Expectations before the opening of Friday's trading session were positive, but stocks closed virtually flat after opening higher. The S&P 500 index continues to trade within an over two-month-long consolidation following January - February sell-off. Just like we wrote in our several Stocks Trading Alerts, the early February sell-off set the negative tone for weeks or months to come. Stocks rallied on better-than-expected big cap tech companies' earnings releases, but will medium-term sentiment improve? It's hard to say. For now, it looks like a flat correction within a medium-term downtrend.
Concluding, the S&P 500 index will probably extend its short-term uptrend following quarterly earnings releases. We may see some positive "window dressing" action ahead of the end of a month today. Investors will wait for tomorrow's Apple, Inc. quarterly earnings release.
If you enjoyed the above analysis and would like to receive free follow-ups, we encourage you to sign up for our daily newsletter – it’s free and if you don’t like it, you can unsubscribe with just 2 clicks. If you sign up today, you’ll also get 7 days of free access to our premium daily Gold & Silver Trading Alerts. Sign up today!
Thank you.
Paul Rejczak
Stock Trading Strategist
Stock Trading Alerts
Sunshine Profits - Free Stock Market Analysis
