
Lately much has been written on whether this rally in the U.S. Dollar is done or not. I explained my view on this topic in the previous essays, however it may seem that the situation has changed since then, so I believe an update is necessary. Analyzing this market is essential to determine what is most likely to take place in the precious metals, as they move in opposite directions most of the time. After all, gold and silver are priced in the U.S. Dollars so their price (in USD) has to be connected to it.
Before presenting my charts (courtesy: stockcharts.com), I would like to remind you that timing the exact bottom is speculation and it is best to use only a part of your money to do it. Having said that, I would like to emphasize that it usually proves profitable to begin with the basic methods of analysis. Later your can apply more and more sophisticated tools to get more details. Please take a look at the chart below with this first things first perspective in mind.
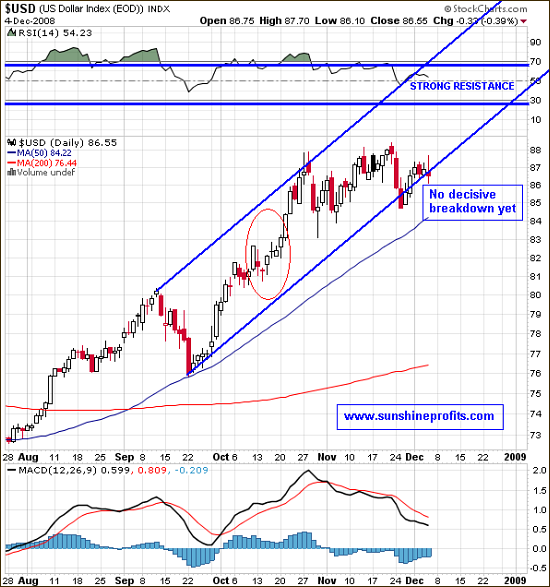
One of the fundamental rules of the technical analysis is that a trend is in place until it reverses. Sounds obvious but what it means is that the trend is likely to continue until there are clear signs that it has reversed. The medium-term trend in the U.S. Dollar is up and it has not been broken yet. If so, we should assume that the trend will continue.
I believe that it will ultimately reverse (fundamentals; major, long-term trend is down), but I doubt that the top is already in. The USD Index did not reach its key resistance levels which are 90 and 92.5 (why these levels?) and is not very near them either. What we are witnessing now is most likely a consolidation before the 5-th Elliott wave of this upswing. A decisive breakdown below the trend line and closing prices below that level for three consecutive days would invalidate this theory. However, for now the U. S. Dollar picture remains bullish.
The red ellipse marks the period when the USD Index paused during the previous upleg and then continued its upward path. There are some similarities between that situation and what we have at the moment of writing this commentary but it is best visible when one takes into account also the developments on the gold market.
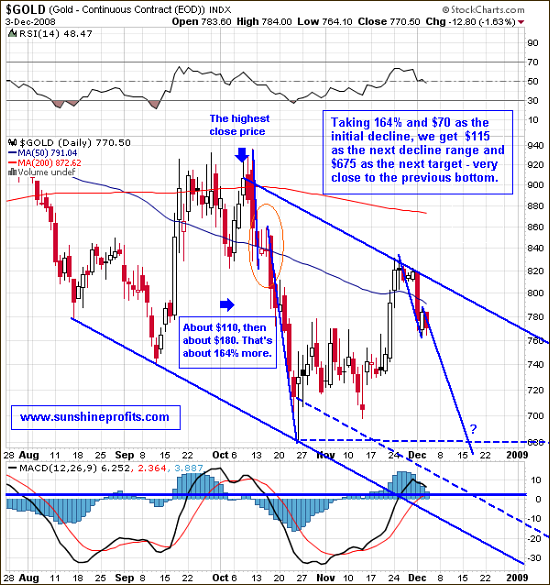
Back in October, the price of gold acted strongly relative to the value of the USD Index, and that is exactly what we have just seen over a week ago. The initial decline after the local top was established, took gold to the first support level, bounced, and then dropped 1.64 times more. Please note how close that is to the 1.618 Fibonacci ratio.
Right now gold has reached the first support level which was established at the beginning of November and bounced. The medium-term trend in gold is down. If the history is to repeat itself, the 1.64 ratio gives us a $675 target for this decline, which is very close to the previous lows. This is one of the support levels that can stop the decline, if it indeed takes place. The strong, long-term support is at the $650 level, just $25 lower, so we could go as low as that, perhaps on an intraday basis.
The $650 support level is additionally strengthened by the lower border of the trend channel (the dashed line). There are two parallel support lines which can be viewed as the border of the channel, as they are drawn using the intraday low and the closing price. Which one should we use? The best answer is the one that works, but since the decline of this significance is an unprecedented event in this bull market we need to take both of them into account.
Summing up, the medium-term trends in both USD Index and gold have not changed. Without significant, confirmed breakdown in the USD Index it is hard to believe that the lows in the precious metals are already in place. In fact, taking into account the abovementioned factors, it seems that the price of gold may go to or below its recent lows.
Of course the market might prove me wrong, as nobody can be right 100% of the time. Should my view on the market situation change substantially, I will send an update to the registered Users along with suggestions on how to take advantage of it. Register today to make sure you wont miss this free, but valuable information. Youll also gain access to the Tools section on my website. Registration is free and you may unregister anytime.
P. Radomski
