
This essay is based on the Premium Update posted on September 16th, 2010. Visit our archives for more gold articles.
Gold prices are rising from the long-term perspective and it's no wonder. Central banks that had one time liked nothing better than to get rid of their gold reserves, are amassing major gold positions. The International Monetary Fund said last week that it sold 10 metric tons of gold to the central bank of Bangladesh raising $403 million. The IMF has already sold 212 tons of gold to the Reserve Bank of India, the Bank of Mauritius and the central bank of Sri Lanka, all in November last year.
So far in 2010 Russia has increased its gold holdings by 2.8 million ounces, $3.6 billion at current prices giving the Russian government a total of almost $30 billion. Saudi Arabia and the Philippines have disclosed new gold buying in 2010, plus India, Sri Lanka and Mauritius bought gold in 2009. We know that the People's Bank of China is also is a major accumulator of gold, gobbling up its local mining production in hopes of having a hedge for its huge mountain of fiat currency reserves.
It seems that demand for gold is rising faster than supply. Mine production has remained flat even as investor demand more than doubled so far in 2010 compared to a year earlier.
Looking back at recent history the best year for mine production was in 1999 when 83.69 million ounces of new gold came out of the ground. Keep in mind that in that year the price of gold was under $300, hitting a low of $256. (That was the year that the luckless former British Prime Minister Gordon Brown ordered the sale of BritainÕs gold reserves.)
It doesn't take a degree in economics to understand that if the price of something soars by some 350% you would want to dig more of it out of the ground and sell it. But last year's mining production hit only 74.46 million ounces, still not enough to surpass 1999's output. So we're not seeing dramatic increases in mine production. Central banks around the world who were permitted under an international agreement to sell a combined 200 tonnes per year, are not even selling an ounce. Just the opposite--they are net buyers rather than sellers.
Scrap gold (people's old jewelry etc.,) is another source of gold coming to the market.
Over the last few years, since the financial crises unfolded and gold prices have gone up, people have been lured by advertisements on late-night television to take out their old gold jewelry and sell it for a profit. So that in 2008, while new mine production barely inched up by 1.38%, scrap gold soared by 34%.
But is scrap gold a never ending supply? There is a limit to the number of grandma's old gold rings people can sell. World Gold Council figures for the first quarter of 2010 show that scrap sales for this period were 11.03 million ounces, a 43% fall from the first quarter of 2009. Demand is growing but supply isn't. Again, you don't need an advanced degree in economics to understand the long-term implications for the price of gold.
Two important developments are seen in this week's long-term GLD SPDR chart. (charts courtesy by http://stockcharts.com.) Gold has moved above its previous high and it has done so on huge volume. Focusing on volume for a moment, most spikes similar to what has been seen of late have resulted in continuation of rallies although some consolidation normally takes place first.
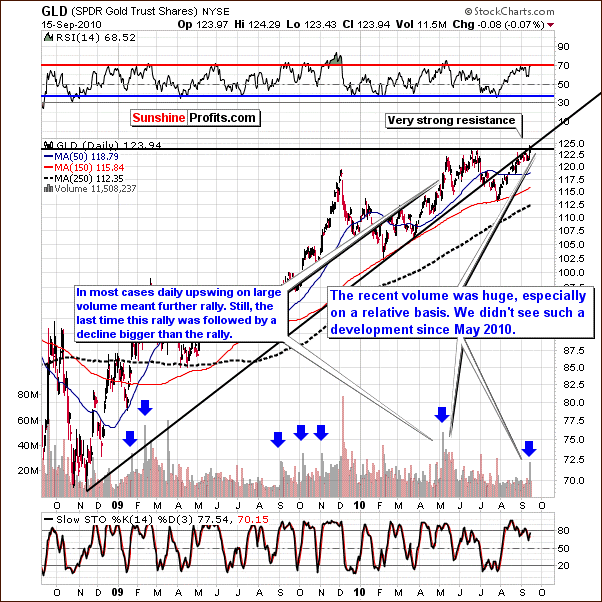
A notable point needs to be made about a similar volume spike seen this past May. The subsequent rally was followed shortly thereafter by a four-week decline to levels in late-July which were lower than those seen prior to the rally. In other words, the volume spike was followed by a rally, which was then followed by a sharp decline with only an occasional small correction interrupting what turned out to be a steady, month-long downtrend. The possibility that this type of pattern could repeat itself must be kept in mind even if gold rallies from here.
As was published in our September 14 Market Alert, "The above doesn't change our opinion regarding one's long-term investments - we remain bullish on the metals here and we believe one should hold them regardless of the possibility of the short-term correction."
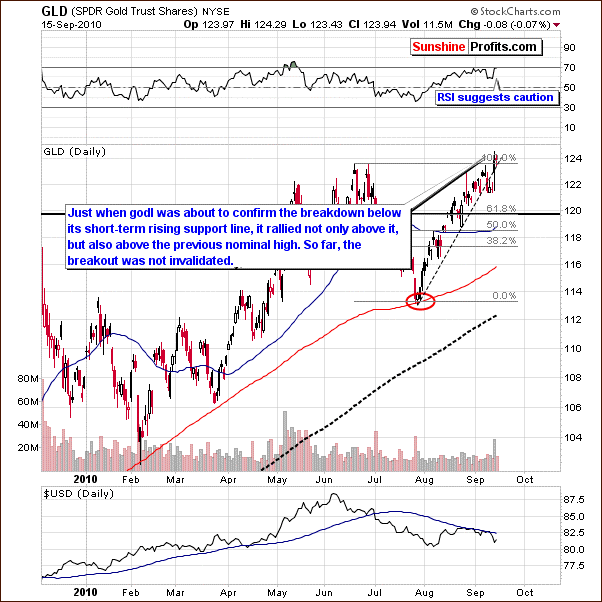
In the short-term chart this week, gold is seen trying to break above its previous June, 2010 high. No plunge in price has been seen even though stocks have rallied and a correction in the precious metals sector has been expected for several weeks. If the breakout fails to hold, there seems to be a good possibility that GLD SPDR could decline. Subscribers to our Premium Service get the specific number in the Premium Update that arrives in their e-mail box.
Another possibility is for gold's spot price itself to move up by an additional $10-$20 or so and close above its previous high. This could be followed by a consolidation back to today's levels which would allow for entry into the market at reduced risk levels. However, it is important to note that the RSI points to caution at this time as the 70-level is quite close today. The old adage "When in doubt, stay out" perhaps should be heeded at this time.
To make sure that you are notified once the new features are implemented, and get immediate access to my free thoughts on the market, including information not available publicly, I urge you to sign up for my free e-mail list. Sign up today and you'll also get free, 7-day access to the Premium Sections on my website, including valuable tools and charts dedicated to serious PM Investors and Speculators. It's free and you may unsubscribe at any time.
Thank you for reading. Have a great weekend and profitable week!
P. Radomski
--
This week we are talking about fear, gold supplies and major accumulators of gold worldwide. Recently gold broke meaningful tendency of being driven by Euro weakness significantly changing possible implications for gold which was the main reason for us to send Market Alert and no longer justify shorting precious metals market.
We've analyzed gold, silver and precious metals mining stocks and commented on recent upswings backed up by high volume, breaking meaningful tendencies and approaching key levels on most of our 19 charts prepared for today. In fact, one of these charts is just a sneak preview of one of newest tools which let us analyze what influence stock options expiration could have on gold prices.
On the other hand, we have seen a spike in the volume on the GDX:SPY ratio, the Gold Miners Bullish Percent Index still suggests caution, and several indicators point to a correction materializing very soon - the short-term signals are mixed. The above - by no means - should be interpreted as a suggestion to sell one's long-term holdings in the precious metals sector as we are in bull market.
We encourage you to Subscribe to the Premium Service today and read the full version of this week's analysis right away.
