
In our last essay, we checked the situation in oil stocks . Back then, we wrote in the summary:
(...) oil stocks reached a very important medium-term support line based on the June and November 2012 lows, which had successfully stopped declines earlier this year. Additionally, the XOI reached the 38.2% Fibonacci retracement level based on the entire June-November rally, which suggests that the sentiment for oil stocks may turn positive in the near future.
Since that essay was published, we have seen an upward move which took the oil stock index to the psychological barrier at 1,500. Will this strong resistance level stop further gains? What happened with crude oil at the same time? Did the recent negative correlation between light crude and oil stocks remain in place? Before we try to answer this question, we'll examine the NYSE Arca Oil Index (XOI) and the WTI to find out what the current situation in the oil market is. Let's start with the XOI short-term chart (charts courtesy by http://stockcharts.com).
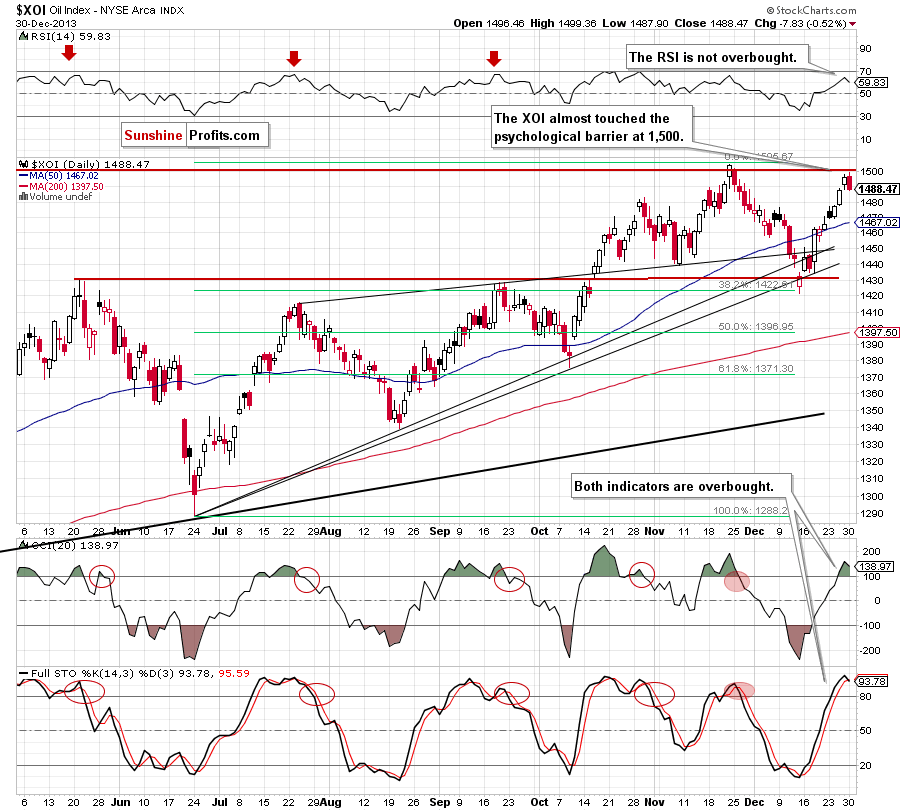
Looking at the above chart, we see that the situation has improved significantly since our last essay was published. At that time we wrote the following:
(…) the XOI reversed course after reaching the 38.2% Fibonacci retracement level based on the entire June-November rally. As you can see on the daily chart, this support encouraged buyers to act, and resulted in an upswing, which push the index above the May high.
Despite this growth, the combination of the previously-broken upper medium-term rising support line and the upper line of the rising wedge stopped further improvement and the XOI closed Monday below this resistance zone. If the buyers do not give up and the oil stock index comes back above this line, we may see an upward corrective move to at least 1,456-1,461 where the 50-day moving average and the previously-broken neck line of the head and shoulders pattern are.
As you can see on the above chart, after a small pause, the buyers managed to push the XOI higher, which resulted in an invalidation of the breakdown below the upper medium-term rising support/resistance and the upper line of the rising wedge, and was a strong bullish signal. In the following days, the oil stock index extended its gains and broke above the neck line of the head and shoulders formation. With this upswing, the XOI also came back above the upper line of the medium-term rising wedge, which was another bullish sign. These circumstances fueled further improvement and the oil stock index almost hit a psychological barrier at 1,500 yesterday.
What’s next? On the above chart, we see that yesterday’s candlestick together with the previous one create a bearish engulfing pattern. Taking this fact into account and combining it with the proximity to the psychological barrier at 1,500 and the position of the indicators, it seems that we may see a correction in the coming days.
What did happen at the same time with crude oil? Let’s take a look at the daily chart.
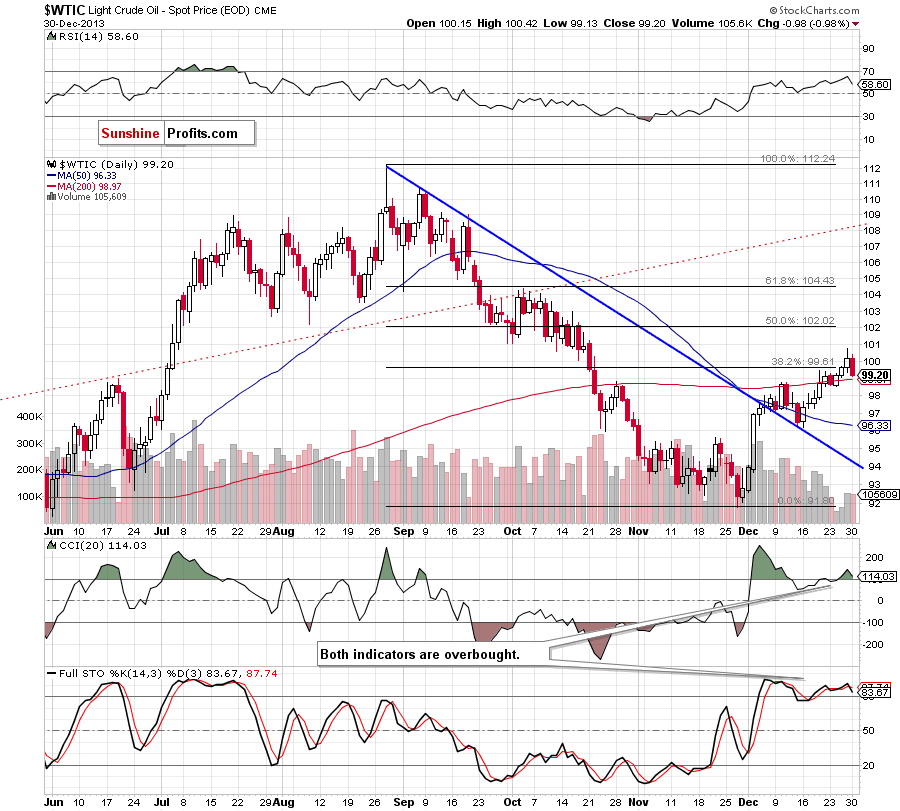
As you see on the above chart, in the middle of the month crude oil bounced off the upper border of the declining trend channel and broke above the 50-day moving average, which was a positive signal that encouraged oil bulls to push the price higher. In the following days, we saw further improvement and light crude approached the 38.2% Fibonacci retracement level. With this upward move, crude oil also broke above the major short-term resistance – the 200-day moving average, which successfully stopped growth at the beginning of the month. This time oil bulls didn’t fail and despite a small drop below this important line, they managed to push the price higher once again. Thanks to this upswing, at the end of the previous week crude oil not only hit its new nine-week high, but also broke above the 38.2% Fibonacci retracement level and the psychological barrier of $100.
These circumstances encouraged oil bears to take profits, which triggered an almost 1% loss yesterday. At this point, it’s worth noting that the CCI and Stochastic Oscillator are overbought and close to generating sell signals. As you can see on the above chart, we saw a similar situation earlier this month. Back then, an invalidation of the breakout above the 200-day moving average triggered a downward move, which pushed the price to the upper line of the declining trend channel. If history repeats itself, and the price drops below this moving average, we will likely see further deterioration.
Having discussed the above, some of you may ask the following question: does this mean that the strong negative correlation has reversed as we have seen similar price action in both oil and oil stocks in recent days? Let’s take a look at the chart below.
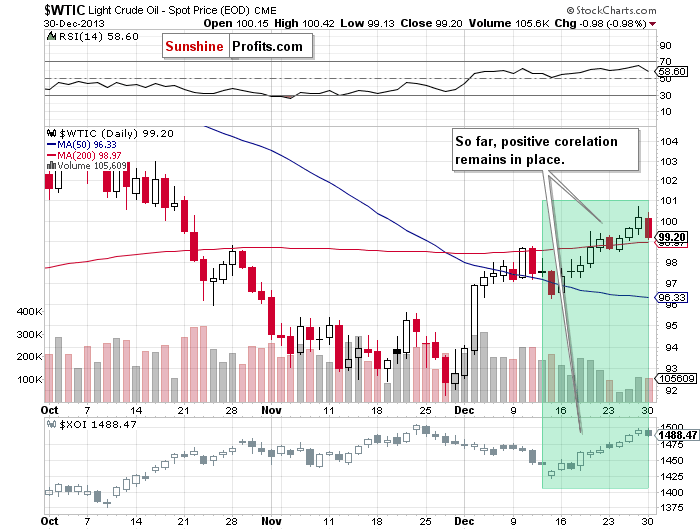
Looking at the above chart, we clearly see that earlier this month there was a strong negative correlation between crude oil and the oil stock index. However, this tendency reversed in the middle of December and they moved higher together during the previous two weeks. Additionally, yesterday they moved lower together.
Summing up, taking into account the recent rally in oil stocks and crude oil and combining it with the current situation in both cases, it seems that the positive correlation between them could remain in place in the coming days. If this is the case, we will likely see lower values of crude oil and oil stocks in the near future.
Thank you.
Nadia Simmons
Forex & Oil Trading Strategist
Oil Investment Updates
Oil Trading Alerts
