
Since my previous essay the short-term situation in light crude has improved. On Friday, U.S. crude oil prices climbed up once again and reached a new 16-month high. Despite this growth, the optimism didn’t last long. Yesterday, U.S. oil prices pulled back sharply from their top as weaker-than-forecast U.S. economic data raised concern that growth will stall in the world’s biggest consumer of oil. The U.S. home sales fell which encouraged investors to lock in profits.
What impact have these circumstances had on the light crude’s chart? Have they changed the outlook for light crude? Will these events trigger a deeper corrective move? Where are the nearest support zones and resistance levels? Let's take a closer look at the charts and find out what's the current outlook for U.S. crude oil.
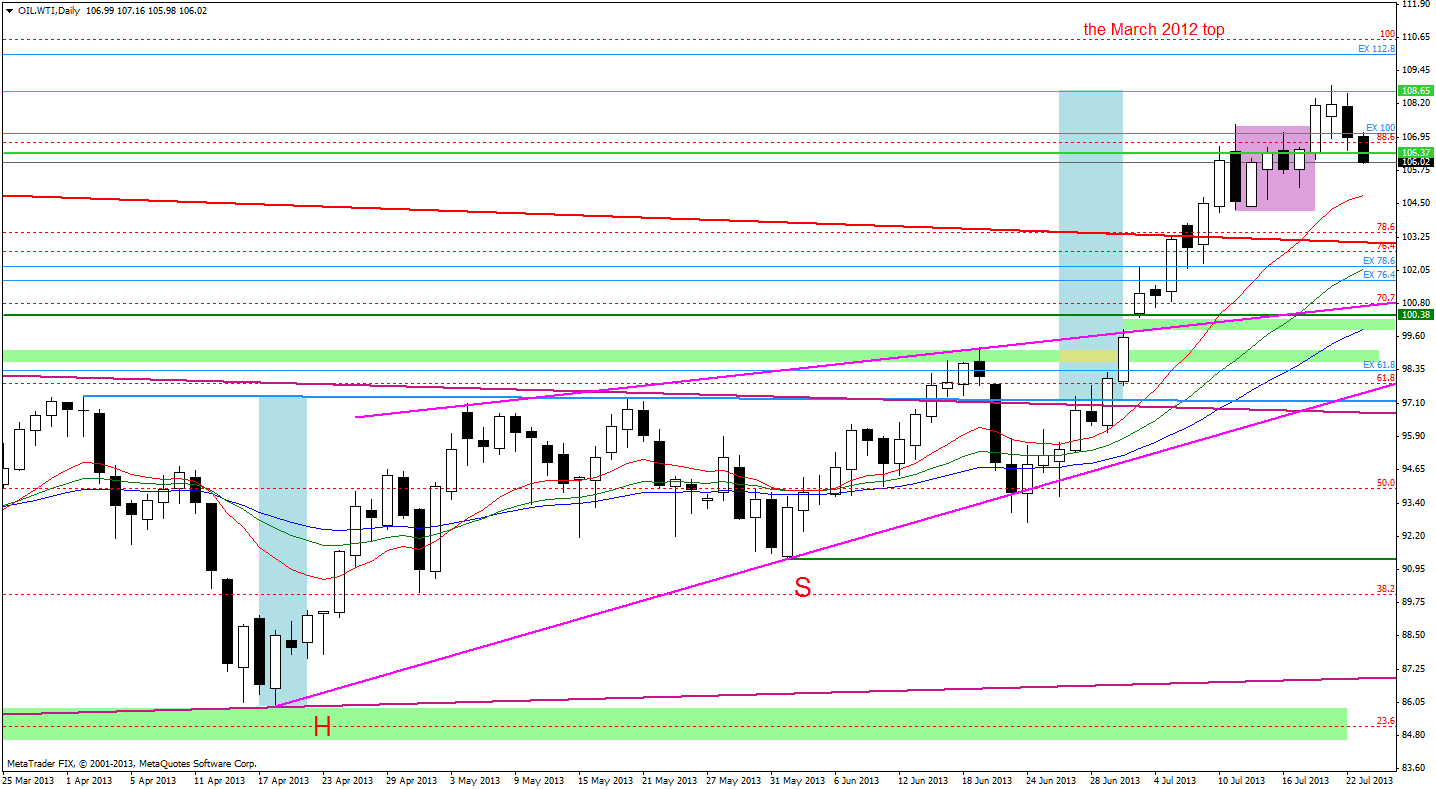
On the above chart we see that the Friday’s increase led light crude's price to a new 16-month high and the price target for the inverse head and shoulders pattern was reached. In this way, the oil bulls witnessed their own pro-growth scenario. This positive event will likely encourage investors to take profits after four weeks of growth. Taking this into account, we should prepare for a correction.
In this case the first support level is around the Wednesday low. The next one is the bottom of the last corrective move (the July 11 low).
Once we know the current situation in the daily chart, let’s take a closer look at the position of technical indicators.
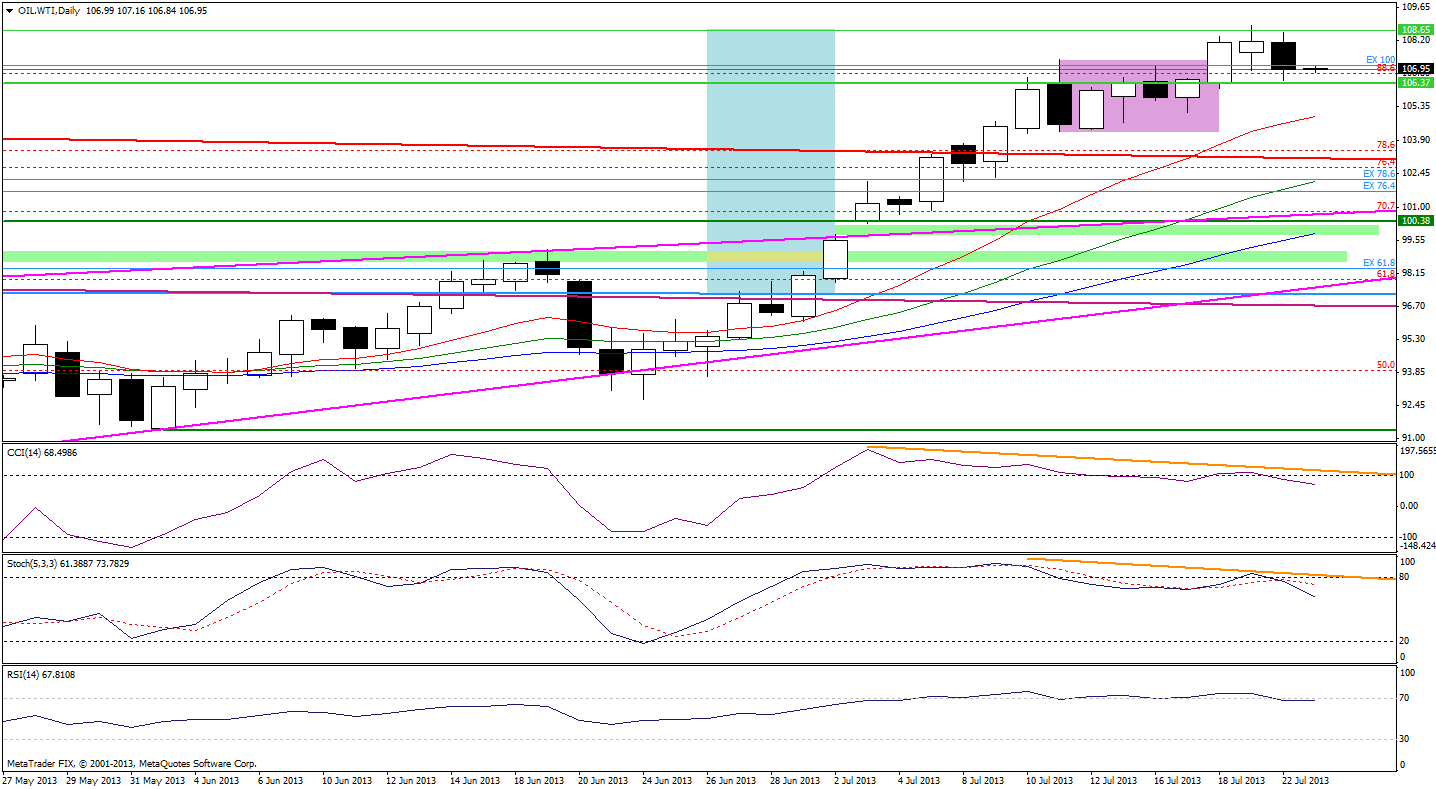
Both the Commodity Channel Index and Stochastic Oscillator have been overbought since the beginning of the July. Additionally, there have been negative divergences on both of them. These circumstances led to the sell signals which were generated yesterday. We can also see that the Relative Strength Index fell below 70 for the first time in 12 days which might be read as another bearish factor.
Once we know the current situation from the daily chart, let's zoom in on our picture of the oil market and see the 4-hour chart.
As I wrote in my essay on crude oil on July 19, 2013:
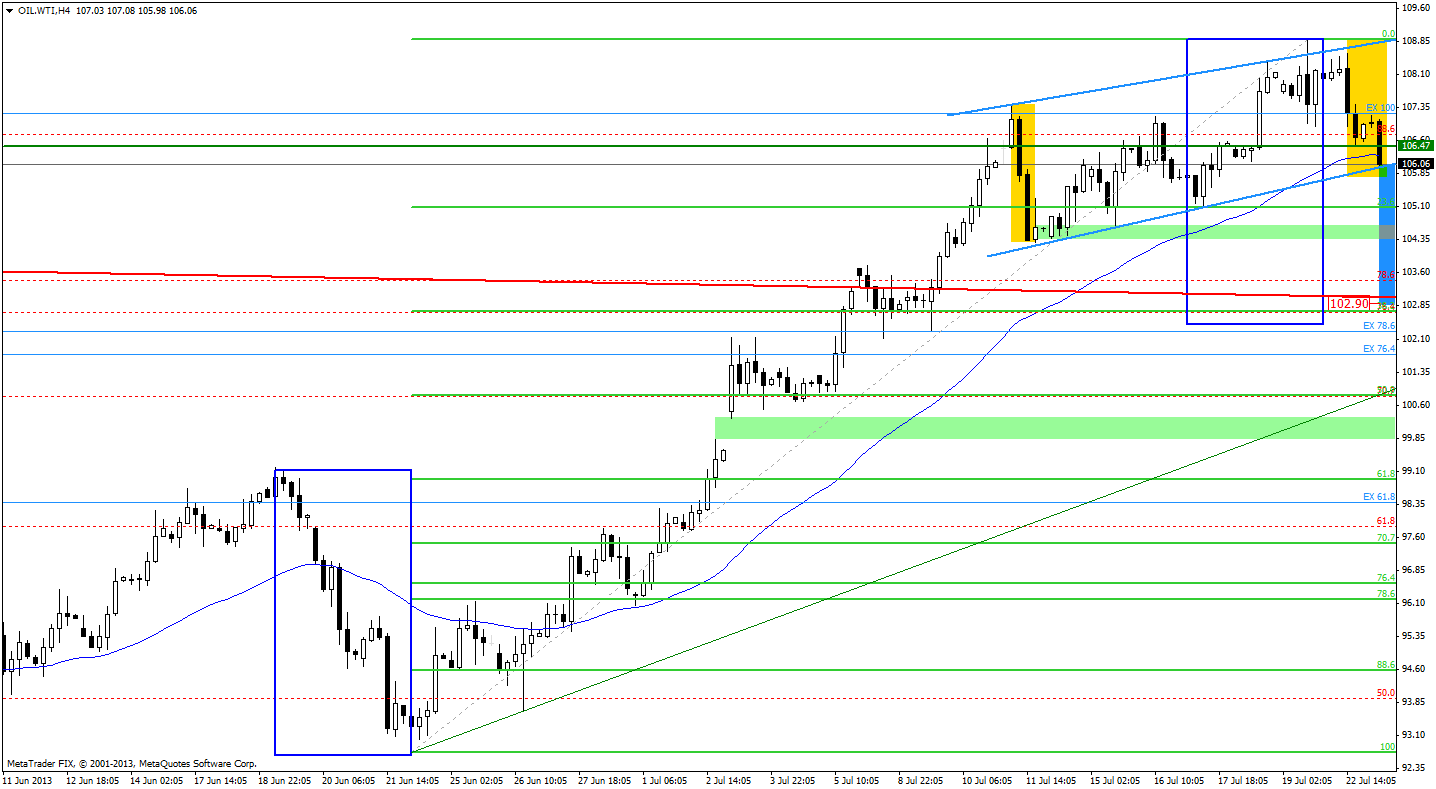
On the above chart we see a blue rising channel. (…) It seems that light crude's moves will unfold in this price channel in the near future.
As I previously mentioned, on Friday, the oil bulls climbed up once again to a new 16-month high. In this way, they broke above the upper line of the blue rising channel. The breakout was invalidated very quickly and the price of light crude returned to the range of the channel. Although the buyers tried to push the price higher once again, they failed yesterday and we saw a decline which took oil to the May 2012 top.
After the May 2012 top and the 45-day moving average were broken today, the next target for the sellers is the bottom line of the above-mentioned rising channel.
Please note that if the price drops below the bottom line of the rising channel (and the breakdown will be confirmed) we might see further declines. The price target for the pattern will be around $102.90 per barrel.
When we factor in the Fibonacci price retracements, we clearly see that there is still much room for further declines because the 23.6% retracement level is much lower than where the price is today. This retracement level coincides with the Wednesday’s low. Below these levels there is a strong support zone based on the July 11 bottom.
However, at this moment the corrective move is still smaller than the previous one, which is a bullish factor. As long as this lasts, an upwards movement is still likely. In this case, the first resistance is the upper line of the rising channel. The next one is Friday’s top.
Summing up, the price of light crude moved higher once again and climbed up to a 16-month high on Friday. In this way, the price target for the inverse head and shoulders pattern was reached which may encourage investors to take profits after four weeks of growth. In this case we should consider a decline. Today (at the moment when these words are written), the oil bears broke below the May 2012 top and the 45-day moving average . Therefore, the next target for the sellers is the bottom line of the blue rising channel (drawn on the 4-hour chart). It is possible that this line will stop the decline, but if it is broken, the price may drop to, at least, the support zone based on the 23.6% Fibonacci retracement level and the Wednesday’s low. However, the short-term technical situation remains bullish and from my point of view, the uptrend is not threatened yet.
Please remember that you should keep an eye on the today’s fresh weekly inventory reports from the American Petroleum Institute (API) and the U.S. Department of Energy's Energy Information Administration (EIA) on Wednesday.
These might have significant impact on further moves in the oil market.
Thank you,
Nadia Simmons
