Based on the March 15th, 2013 Premium Update. Visit our archives for more silver & gold articles.
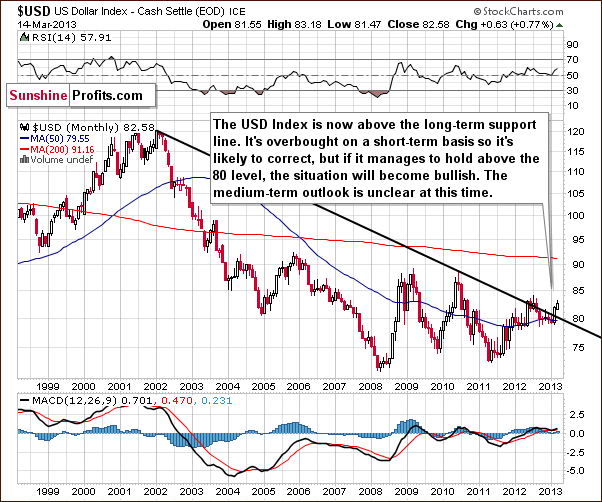
Recent developments on the currency market may worry some gold and silver investors, as dollar refused to move lower at the cyclical turning point, an issue which we touched upon in our last essay, and euro seems to have broken below its medium-term rising support line. This is so because we’re used to strong negative correlation between these precious metals and the USD and the abovementioned situation seemingly suggests a bullish outlook for the U.S. currency (further supported by a negative one for euro). And this is why we invite you to read today’s essay portion, as it reveals some interesting facts that shed new light on the outlook for the currency market and its link with precious metals. We’ll start with USD’s long-term chart (charts courtesy by http://stockcharts.com.)

In the very long-term USD Index chart, we have seen the situation change somewhat this week. The breakout here is now quite significant, and we must consider the possibility that the USD Index might move higher in the medium term. The situation in the short term, however, is overbought, so it is likely that we will see the index decline soon and then we’ll see what happens next.
If the correction stops at the declining support line, around the 80 level, then the breakout will be confirmed, and a rally will likely follow. If however, the correction takes the index below the 80 level, the whole breakout will be invalided, and lower values would probably follow. At this time, the medium term and long-term outlooks are somewhat unclear based on this chart alone.
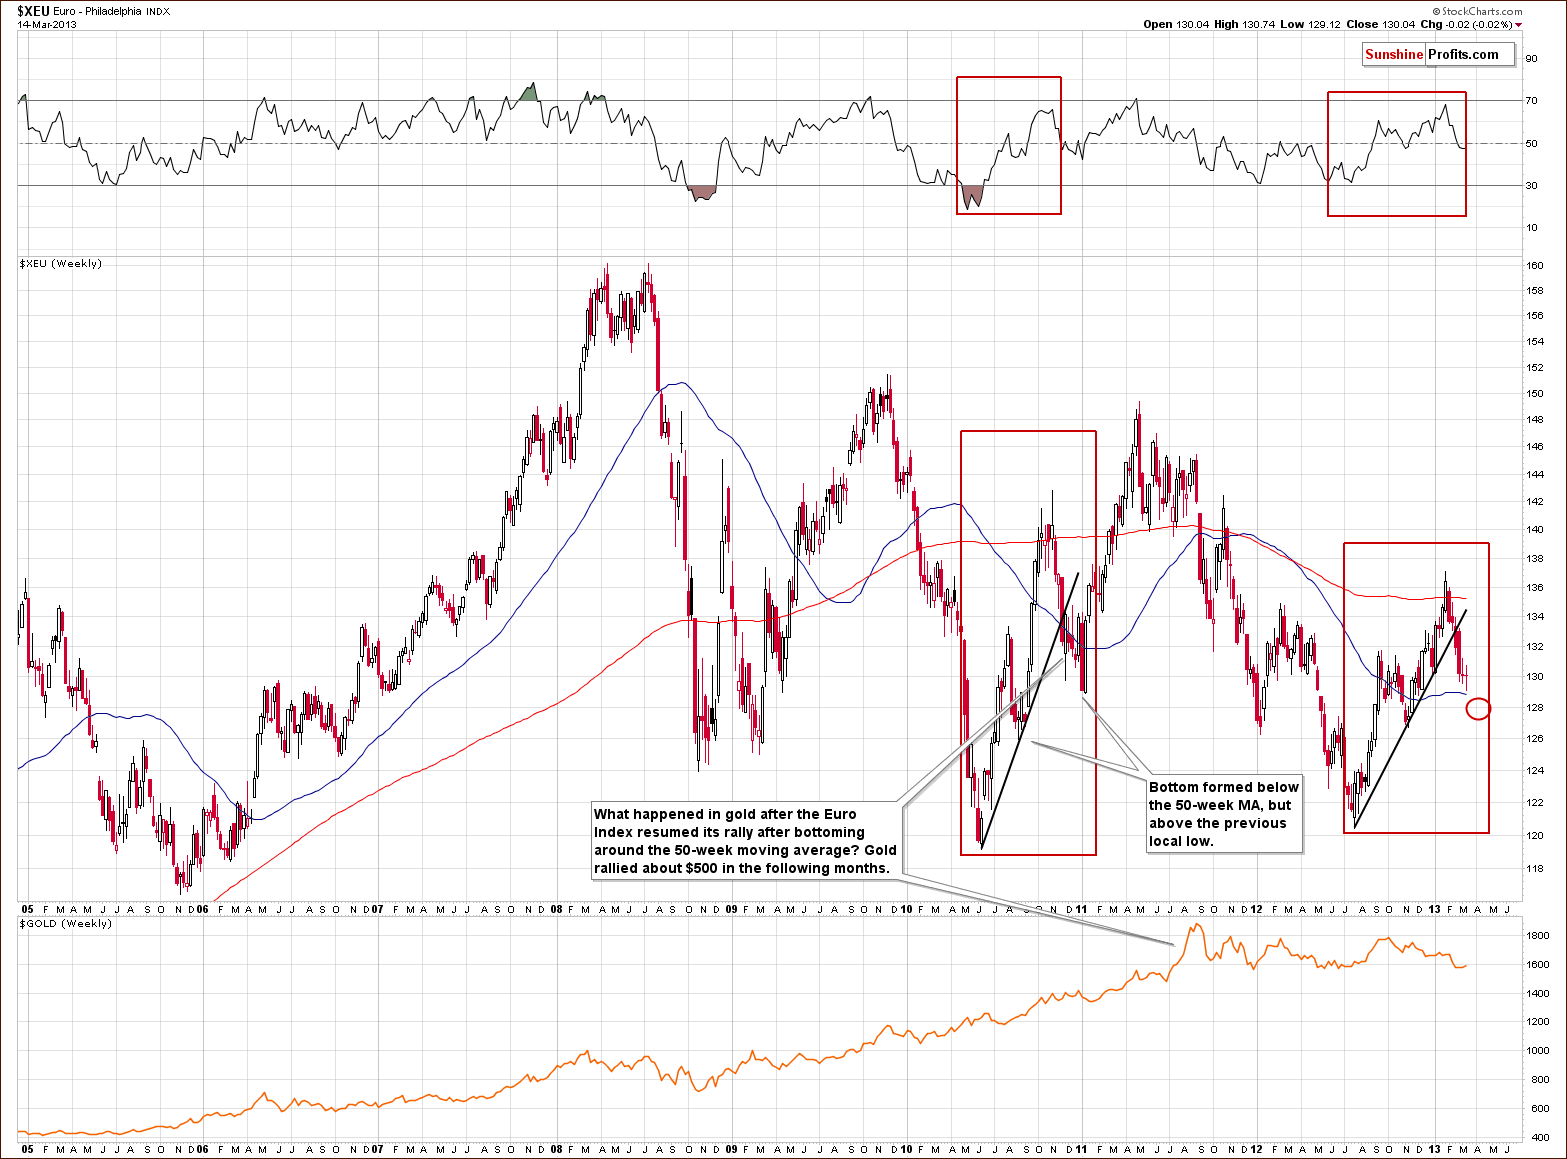
Let us move on to euro’s long-term chart

We did some investigative work this week as we had a feeling that the corrective short-term price swings are probably something, which we have seen before. Perhaps the breakdown here should not be trusted. This chart is a result of our long-term research on the Euro Index, and we found patterns similar to what we’ve seen over the past seven months back in late 2010 and early 2011. At that time, the euro rallied sharply, corrected just as sharply, and then continued to move higher. Before the move to the upside, it had broken below its short-term support line. A few weeks ago, we also saw this happen.
The 50-week and 200-week moving averages are currently positioned quite similar to how they were in the 2010-2011 comparison period. The bottom formed around the 50-week moving average and there was some back and forth trading, but the index did not move below the previous local bottom. It seems unlikely that the euro will decline much further from where it is now before forming a local bottom.
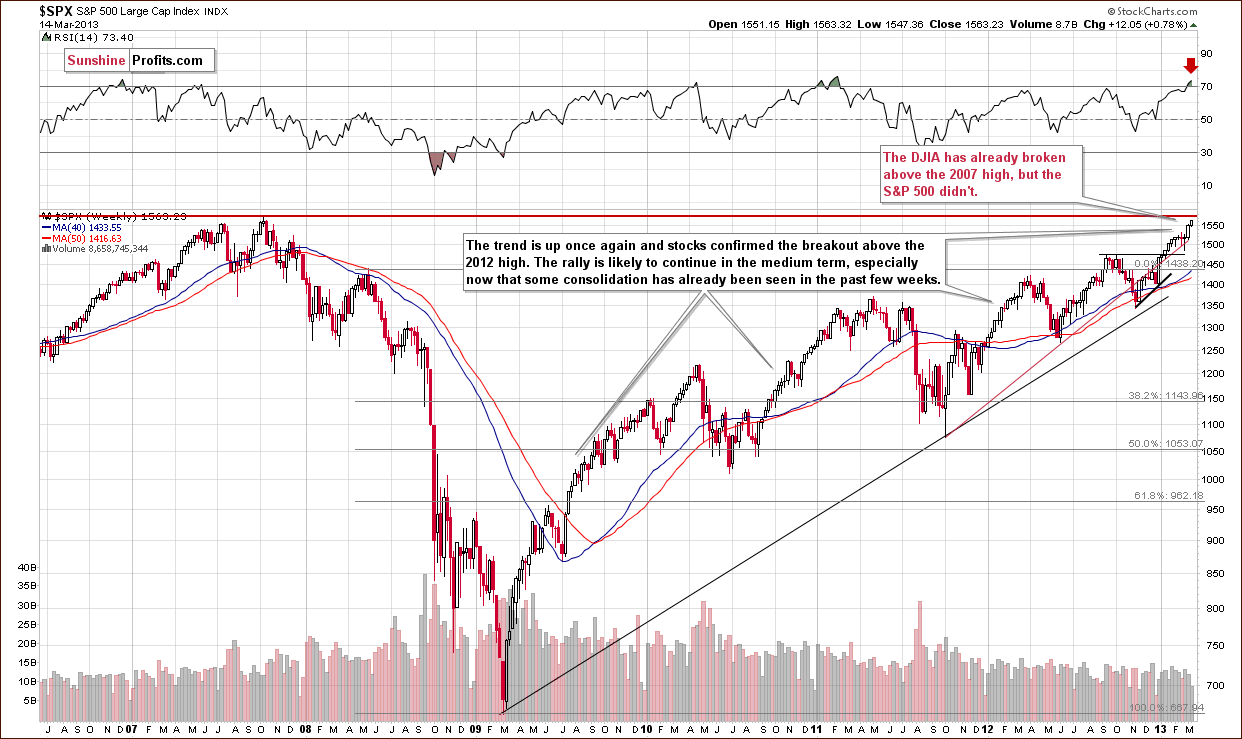
Now, let’s have a look at the general stock market – we’ll use S&P 500 Index as a proxy.

We see that the broad market has yet to break out above its 2007 high. The Dow Jones Industrials did so, but the S&P 500 have not, so there is no confirmation of a breakout here. This creates a particularly interesting situation.
It seems that the S&P 500 could rally further as their major resistance line has not yet been reached. The Dow Industrials could also rally further since they have already broken out above the resistance level of the 2007 highs. A pause, however, would be likely once the S&P 500 reached their 2007 high.
Our best guess at this time is that the S&P 500 will likely consolidate below the 2007 top, and the Dow Industrials’ consolidation will probably take the form of a post-breakout breather. The RSI suggests an overbought situation, so some consolidation is expected at this time. We expect the rally to continue after a few weeks of consolidation. We will be more certain of a medium-term rally after the breakout is also seen in the S&P 500. Such a development appears quite likely at the moment.
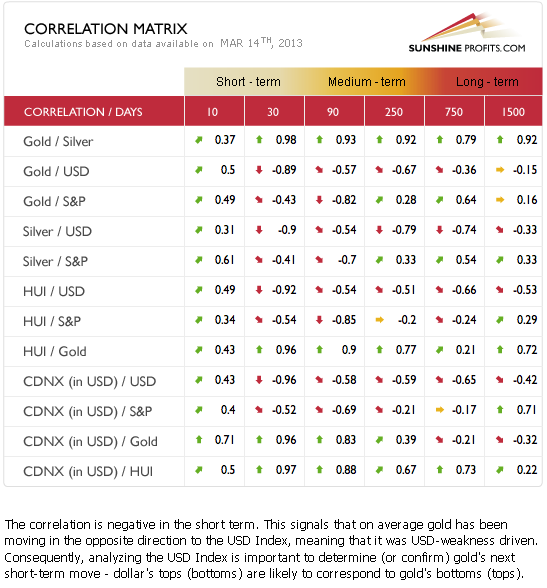
Let’s now move on to intermarket correlations to see how the situation in currencies and stocks could influence gold and silver.

The Correlation Matrix is a tool, which we have developed to analyze the impact of the currency markets and the general stock market upon the precious metals sector. We have two things, which we wish to comment on today. First, the link between the USD Index and gold is negative for the short and medium term. In daily price moves, however, it seems that what happens in the USD Index has been rather irrelevant. Gold and the precious metals have simply refused to move lower when the dollar moved higher.
Our second point is the negative correlation between the precious metals and the general stock market. The link has not been as strong in the last few days, as gold and the precious metals have not declined, although stock prices were rising. When a correction is seen in the general stock market or a period of consolidation begins, the precious metals sector could respond with higher prices.
At this time it seems that the precious metals are anti-assets, just as gold is a hedge against turmoil in the stock and currency markets. As investors become more optimistic about these markets, they sell their gold. It does not mean that in the long run gold cannot rally along with stocks. For instance, both are fueled by low interest rates and quantitative easing. This tells us that a short-term consolidation in the stock market could easily have a positive impact on gold.
Summing up, we could see additional short-term strengths in the USD Index along with weakness in the Euro Index. Neither will probably move very much, and there may be little to no negative impact to gold and the rest of the precious metals sector. It used to be the case that when the USD Index and stocks moved higher, precious metals prices declined. Since the most recent cyclical turning point for the USD Index however, this has no longer been the case. Consequently, we are quite likely to see higher precious metals prices in the coming weeks. The situation could change if gold and silver break below their key support levels (and keeping stop-loss orders is a good idea), but at this moment it still seems that higher, not lower, prices will be seen.
We encourage you to sign up for our Premium Service that will allow you to read today's Premium Update with specific stop-loss details for gold, silver, and the HUI Index as well as detailed suggestions for taking advantage of the current situation on the precious metals market.
Thank you for reading. Have a great weekend and profitable week!
Sincerely,
Przemyslaw Radomski, CFA

