
This essay is based on the Premium Update posted November 10th, 2009. Visit our archives for more silver articles.
In my previous essay, apart from commenting on the current situation and suggesting that gold did not reach a major bottom yet, I also examined the situation in China. I wrote the following:
Considering the high savings rate in China (mostly in the 30% - 40% area in the previous years), gold is a logical investment for the Chinese and it's possible that billions of dollars in Chinese private investment could move into gold in coming years. Already there is talk of China overtaking India as the world's largest consumer of gold.
It was only in April of this year that the world found out that China had increased its gold reserves by a whopping 76 percent to 1054 tons since 2003, moving from 10th place to 7th in terms of global central bank rankings. The Chinese government now owns 30 times the gold it held in 1990. And China is believed to be a leading candidate to buy some or all of the gold the International Monetary Fund still has to sell, after India bought the other 200 a few months ago.
Keep in mind that as China's reserves continue to grow, it will have to purchase gold just to maintain the small gold-to-reserves ratio of 2 % that it currently has, let alone increase it. Therefore, the country must continue buying gold.
Even with the increase in its gold holdings, as a percent of China's total reserves, (about 2%), gold is still a pittance, mere pocket change. Compare that with the international average of 10.2 percent held by central banks worldwide and you can understand why China is so eager to catch up. Last year China overtook South Africa as the world's leading producer of gold and apparently a good portion of this gold is finding its way into its central bank vault.
If the newspaper reports in the China Youth Daily are accurate then China plans to increase its gold holdings by another 5,000 tons of gold over the next three to five years. That's more than double the total annual global production. Keep in mind that the total annual global gold production is only about 2,500 tons per year, and obviously China cannot buy the whole lot. With current prices, buying 5,000 tons over the next three to five years would cost about $180 billion - still a small portion of China's dollar reserves.
This is just speculation, but let's consider what would happen to the gold price if China increased its gold reserves from 2% to just 5%.
At a bargain price of say, $1,000 gold, it would cost $55.3 billion to push China's gold holdings to 5% of reserves.
Chinese reserves are about $2.3 trillion, and of that, $1.6 trillion, or 70% are denominated in U.S. dollars. The cost to pushing its gold reserves to just 5%, which is still 5% lower than the global average, would be a pittance compared to the amount of money losing its value every day that China holds in its hands.
China's problem is that it can't buy all that gold without moving the market. I would expect China to buy on the dips, creating a solid floor for the yellow metal and eventually pushing the price of gold higher - much higher.
Therefore, there are many reasons as to why the fundamental situation remains positive, which means that the bull market is still far from the ultimate top - I believe the latest one (predicted for weeks) was just a local one, and price will sooner or later move above it. However, from the short-term point of view the decline may not be over yet. In the following part of this essay I will provide you with my analysis of the silver market (charts courtesy of http://stockcharts.com.)
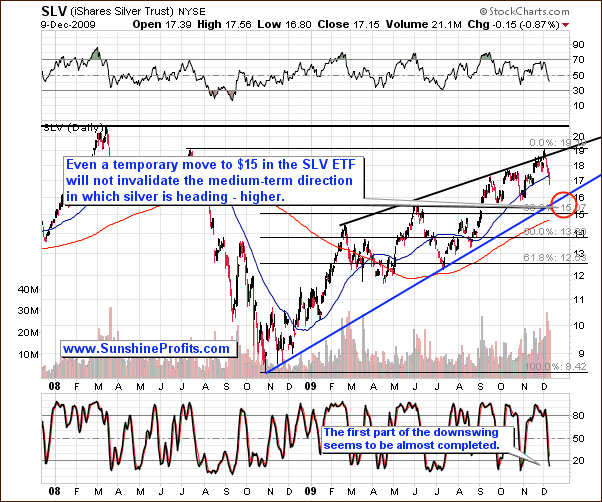
The situation on the silver market is similar to the one in gold as far as the overall implications are concerned. The decline has been sharp and took SLV from 19 to 17 in a relatively short time frame, but it did not reach a strong support level yet. The above long-term chart suggests that the next major bottom is likely to form between $15 and $16 - in the area marked with a red ellipse.
However, there are signs that there will be an intermediate bottom along the way, and this is much more visible on the short-term chart.
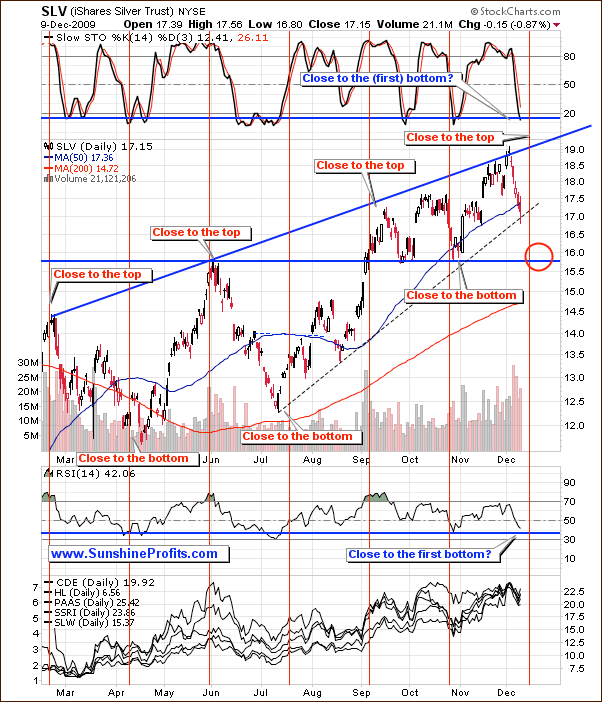
The correction to the $15-$16 area could correspond to the June top, and also to the two bottoms in September, which makes the support in this area even stronger. Still, the short-term dashed support line has not been broken, which may mean that silver will pause here for several days before declining again.
The similarity between current situation in gold and silver is even more visible when one takes a look at the RSI and Stochastic indicators. Both of them are just about to reach the blue horizontal line, which in the past meant that a local bottom is very close.
Summing up, silver - just like gold - appears to be ending the first part of the current decline. Naturally, the white metal may move higher at any time due to the positive fundamental situation, so I'm not advocating being totally out of the PM market at this moment. Detailed suggestions as far as portfolio structuring is concerned are available to my Subscribers, along with the full version of this essay (15 detailed charts with implications on your portfolio).
To make sure that you are notified once the new features (like the newly introduced Free Charts section) are implemented, and get immediate access to my free thoughts on the market, including information not available publicly, I urge you to sign up for my free e-mail list. Sign up today and you'll also get free, 7-day access to the Premium Sections on my website, including valuable tools and charts dedicated to serious PM Investors and Speculators. It's free and you may unsubscribe at any time.
Thank you for reading. Have a great and profitable week!
P. Radomski
--
In this week's Premium Update, I cover the long-, and short-term charts for gold, silver, PM stocks, USD Index, and main stock indices. Moreover, I analyze the price of Apple, Inc. (yes, in a way it is related to the precious metals market). Additionally, I feature and comment on the very recent signals from two of our indicators and explain how one can read them.
