

The U.S. stock market indexes were mixed between -0.2% and 0.0% on Thursday, after going down to support levels and rebounding before the closing bell. The S&P 500 index trades 8.5% below January 26 record high of 2,872.87. The Dow Jones Industrial Average was unchanged and the technology Nasdaq Composite lost 0.2% on Thursday. Overall, it was a relatively bullish trading session, despite negative daily changes.
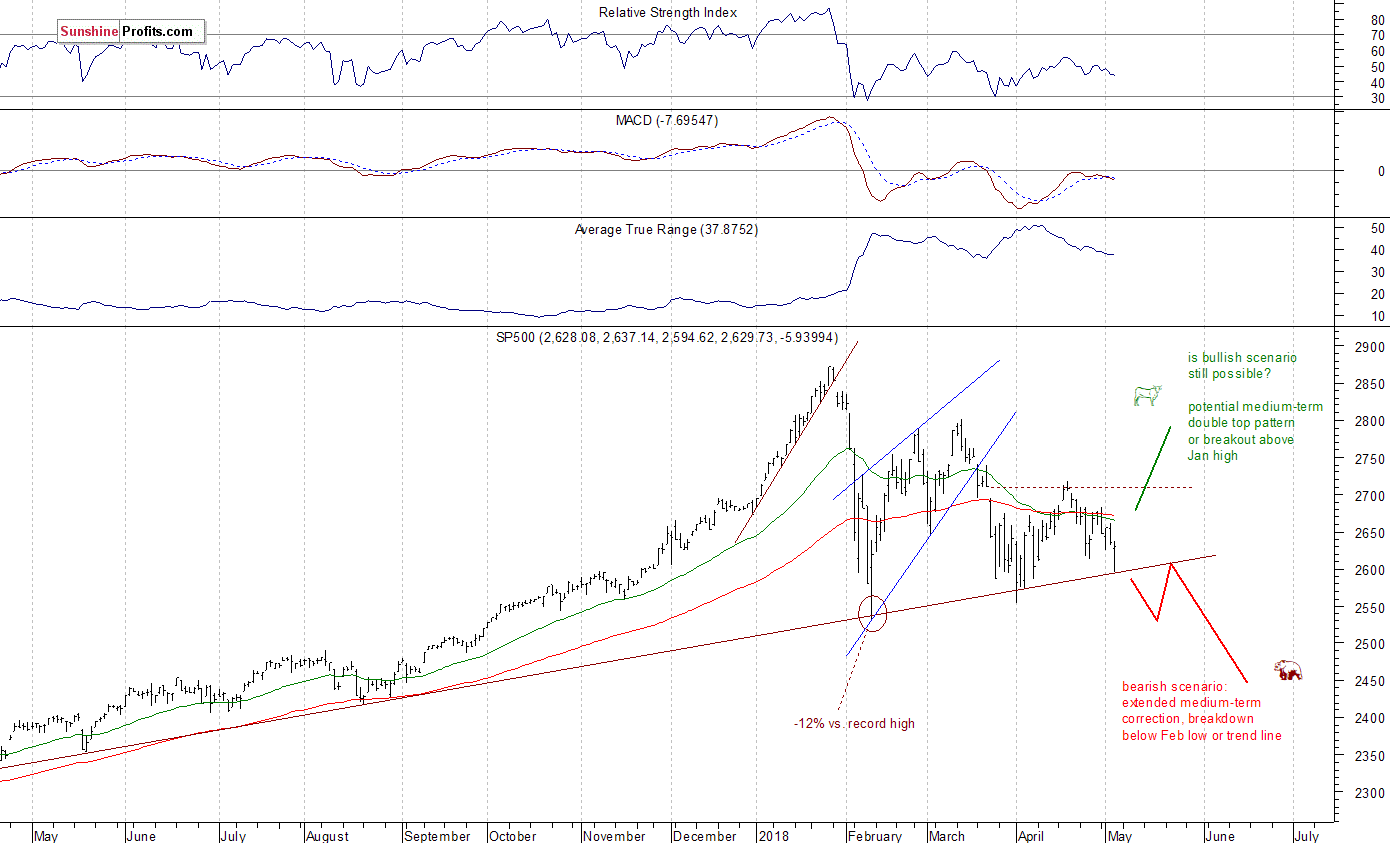
The nearest important level of resistance of the S&P 500 index is now at around 2,640-2,650, marked by previous level of support. The next resistance level is at 2,660, marked by recent local highs. On the other hand, support level is at 2,600-2,610, marked by recent fluctuations. There is also an over year-long medium-term upward trend line.
The broad stock market continues its medium-term consolidation following late January - early February sell-off. There are still two possible medium-term scenarios - bearish that will lead us below February low following trend line breakdown, and the bullish one in a form of medium-term double top pattern or breakout towards 3,000 mark. There is also a chance that the market will just go sideways for some time, and that would be positive for bulls in the long run (some kind of an extended flat correction):
Slightly Negative Expectations Ahead of Data Releases
Expectations before the opening of today's trading session are slightly negative, because the index futures contracts trade 0.2% lower vs. their yesterday's closing prices. The European stock market indexes have been mixed so far. Investors will wait for some important economic data announcements: Nonfarm Payrolls number, Unemployment Rate at 8:30 a.m. The monthly jobs data release is usually followed by an increased market volatility. The S&P 500 index may extend its recent fluctuations along the above-mentioned year-long upward trend line. There have been no confirmed negative signals so far.
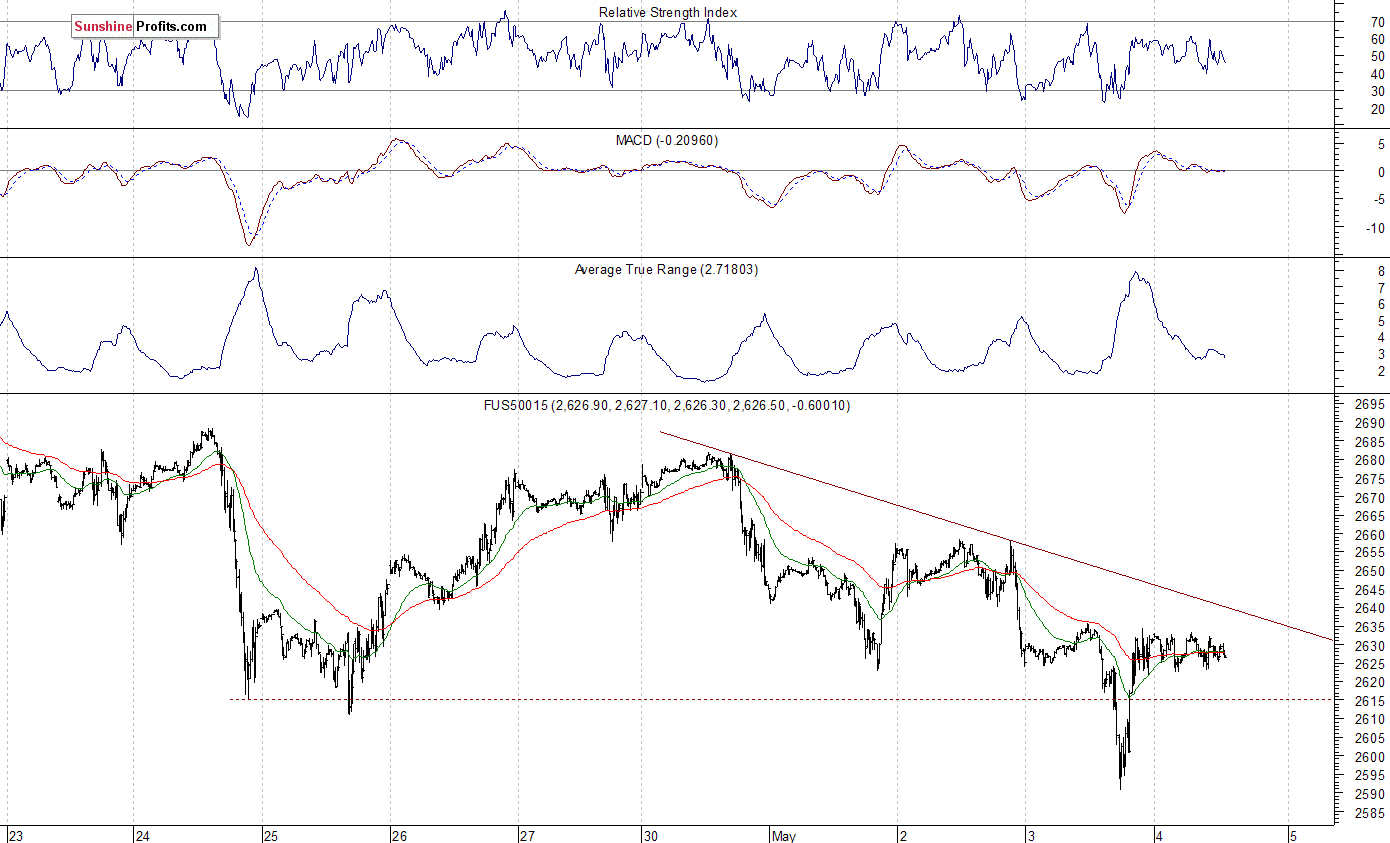
The S&P 500 futures contract trades within an intraday consolidation, as it fluctuates after yesterday's rebound. The nearest important level of support is at around 2,620, marked by short-term local lows. The next level of support is at 2,590-2,600. On the other hand, resistance level is at 2,630-2,640, among others. The futures contract trades along its previous local low, as the 15-minute chart shows:
Nasdaq Going Sideways as Well
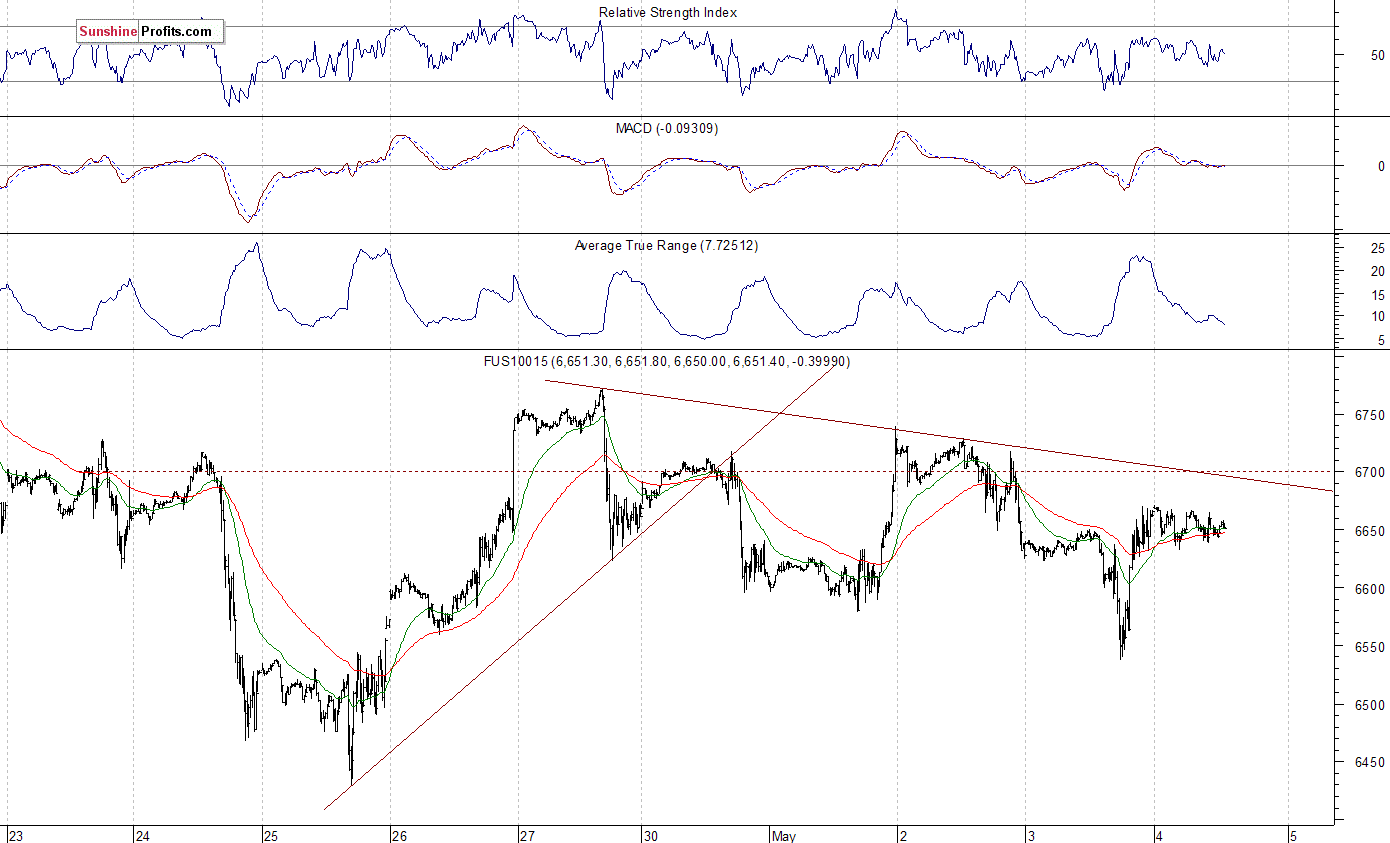
The technology Nasdaq 100 futures contract follows a similar path, as it fluctuates after yesterday's rebound off support level. Big cap tech stocks were volatile recently, as investors reacted to quarterly earnings releases. The market fell closer to 6,500 mark on Thursday, but it quickly came back above the level of 6,600. The nearest important resistance level is now at 6,680-6,700. On the other hand, support level is at 6,550-6,600, among others. The Nasdaq futures contract trades below its slightly descending short-term downward trend line, as we can see on the 15-minute chart:
Apple, Amazon - Mixed Picture
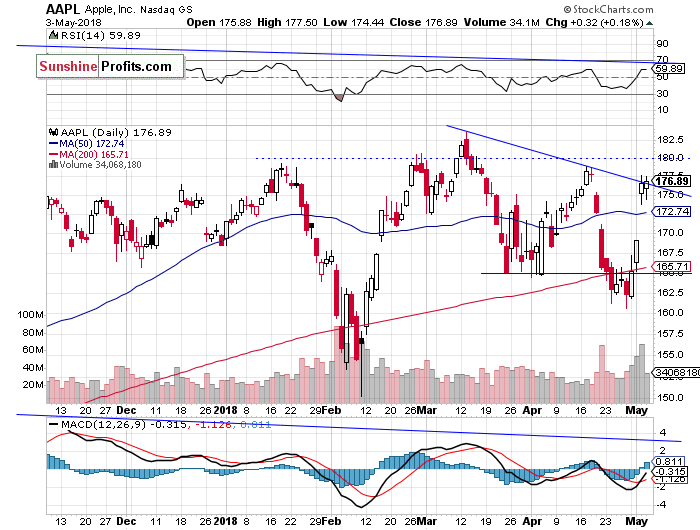
Let's take a look at Apple, Inc. stock (AAPL) daily chart (chart courtesy of http://stockcharts.com). It was gaining ahead of Tuesday's quarterly earnings releases, and it rallied after the fact. On Tuesday we wrote, that "we will likely see a more clear reaction. Probably to the upside, as there seems to be some "sell the rumor, buy the fact" action going on". And we were right! Potential level of resistance remains at around $175-180. There is a slightly descending downward trend line:
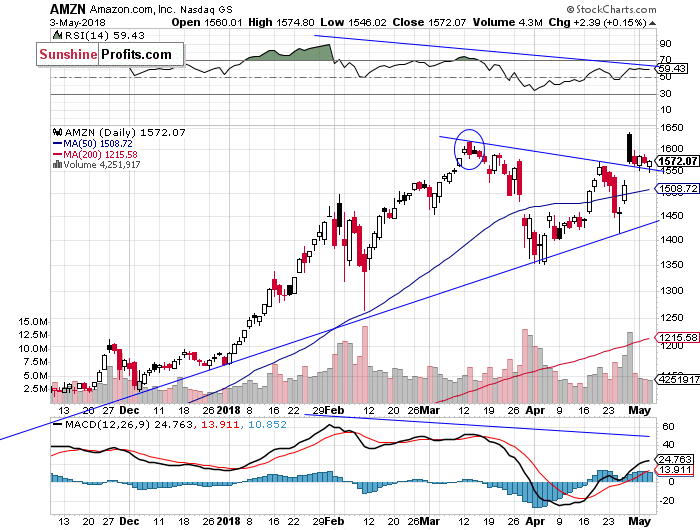
Now let's take a look at Amazon.com, Inc. stock (AMZN) daily chart. The price reached new record high last Friday, as investors reacted to better-than-expected quarterly earnings release. Then, on the same day it sold off below $1,600. Is this a downward reversal or just correction following breakout higher? If the price breaks below support level of around $1,550, we could see more selling pressure. It still looks like a short-term downward correction:
Dow Jones Slightly Below 24,000 Mark Again
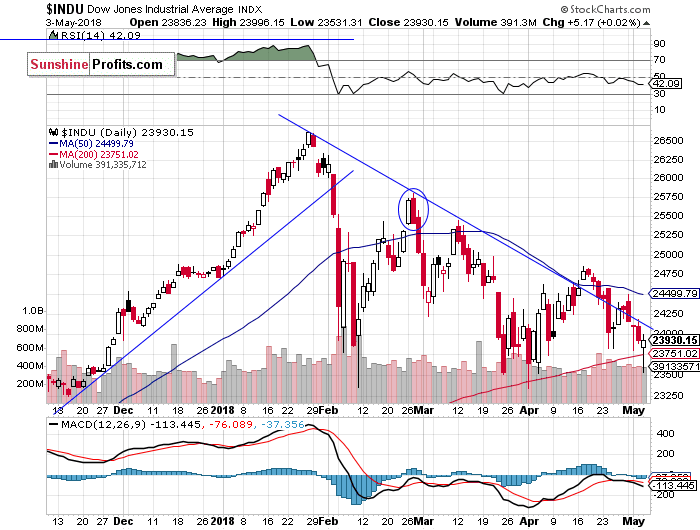
The Dow Jones Industrial Average broke below its medium-term downward trend line again, as it fell towards its recent local low. Then the blue-chip index bounced again. It continues to trade below resistance level of around 24,800-25,000. Will it resume its uptrend after a downward correction? The support level remains at around 23,800-24,000. The blue-chip index extends its medium-term fluctuations:
The broad stock market extends its medium-term consolidation following the early February sell-off. Just like we wrote in our several Stocks Trading Alerts, the early February sell-off set the negative tone for weeks or months to come. Stocks rallied on better-than-expected big cap tech companies' earnings releases recently, but they came back lower after Wednesday's FOMC Statement release. It still looks like a flat correction within a medium-term downtrend.
Concluding, the S&P 500 index will probably extend its short-term fluctuations today. However, it will be all about monthly jobs data release at 8:30 a.m. We could see an increased volatility following that release. The broad stock market will probably stay above its medium-term upward trend line for some time.
If you enjoyed the above analysis and would like to receive free follow-ups, we encourage you to sign up for our daily newsletter – it’s free and if you don’t like it, you can unsubscribe with just 2 clicks. If you sign up today, you’ll also get 7 days of free access to our premium daily Gold & Silver Trading Alerts. Sign up today!
Thank you.
Paul Rejczak
Stock Trading Strategist
Stock Trading Alerts
Sunshine Profits - Free Stock Market Analysis
